

需求
看到别的公司做的要图标绘,我们也想做一个,所以我就研究一下怎么实现。
像进攻方向、钳击、聚集地这些,网上已有大佬开源,我之前已集成到我的Demo中。
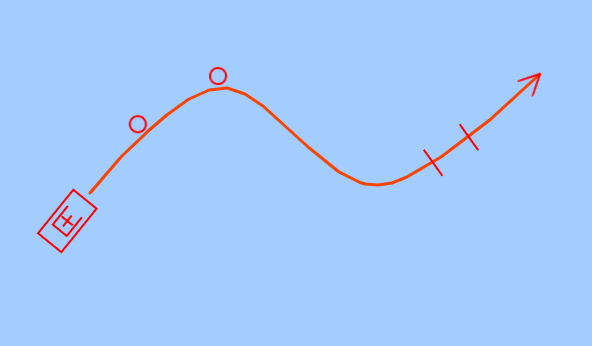
要图标绘的标号虽然很多,多数都是点状的,相对比较简单。有些线状的比较复杂,如下图所示:
![图片[1]-Leaflet 军事标绘 复杂图形 实现-牛翰网](https://niuimg.niucores.com/wp-content/uploads/2025/05/3783195207093374433.png)
说明:因为我没有相关的svg图形,使用其它svg图形拼凑的,图形本身是个四不像,后面只要换一下svg图形就行了。
这篇文章主要讲解一下,我是如何实现的。
实现原理
- 样条曲线
为什么是样条曲线而不是二次或三次贝塞尔曲线呢?因为不确定绘制几个点。
我的算法基础比较弱,以前我只能上网搜索开源代码,现在直接问DeepSeek就可以了,我让它封装成js方法,这种经典算法,它给的封装好的js方法可以正确运行。 - svg图形
曲线上的图形,通过svg实现。项目中用到的标号,也是通过svg格式提供的。 - svg图形的旋转角度
接下来最关键的,就是svg图形的旋转角度,这个算法,问DeepSeek不太好问,它也很难一次性给出正确的代码,所以主要是自己写。
样条曲线算法
样条曲线算法
/**
 * 获取样条插值曲线点的坐标
 * @param {Array} points - 输入的坐标点数组,格式为 [[number, number], ...]
 * @param {number} numSegments - 每两个原始点之间的曲线分段数
 * @returns {Array} 平滑曲线的坐标点数组
 */
L.PlotUtils.getSplineCurve = function (points, numSegments = 25) {
    if (points.length < 2) return points.slice();

    // 扩展点数组处理边界情况
    const extendedPoints = [
        points[1],          // 添加第二个点作为起始虚拟点
        ...points,          // 原始点
        points[points.length - 2] // 添加倒数第二个点作为结束虚拟点
    ];

    const curvePoints = [];

    // 遍历每个中间段生成曲线
    for (let i = 1; i <= extendedPoints.length - 3; i++) {
        const p0 = extendedPoints[i - 1];
        const p1 = extendedPoints[i];
        const p2 = extendedPoints[i + 1];
        const p3 = extendedPoints[i + 2];

        // 生成当前段的曲线点
        for (let t = 0; t < 1; t += 1 / numSegments) {
            const t2 = t * t;
            const t3 = t2 * t;

            // Catmull-Rom样条插值公式
            const x = 0.5 * (
                (2 * p1[0]) +
                (-p0[0] + p2[0]) * t +
                (2 * p0[0] - 5 * p1[0] + 4 * p2[0] - p3[0]) * t2 +
                (-p0[0] + 3 * p1[0] - 3 * p2[0] + p3[0]) * t3
            );

            const y = 0.5 * (
                (2 * p1[1]) +
                (-p0[1] + p2[1]) * t +
                (2 * p0[1] - 5 * p1[1] + 4 * p2[1] - p3[1]) * t2 +
                (-p0[1] + 3 * p1[1] - 3 * p2[1] + p3[1]) * t3
            );

            curvePoints.push({ x, y });
        }
    }

    // 确保包含最后一个原始点
    let lastPoint = points[points.length - 1];
    curvePoints.push({ x: lastPoint[0], y: lastPoint[1] });

    return curvePoints;
}
切线算法
/**
 * 计算样条曲线在指定百分比位置的坐标及切线向量
 * @param {Array} points - 原始坐标点数组,格式 [{x: number, y: number}, ...]
 * @param {number} t - 曲线位置百分比参数,取值范围 [0, 1]
 * @returns {Object} 包含坐标和切线的对象 {x, y, dx, dy}
 */
L.PlotUtils.getSplineCurvePointAndTangent = function (points, t) {
    if (points.length < 2) return { x: 0, y: 0, dx: 0, dy: 0 };

    // 按曲线总长度的百分比
    let tR;
    if (t == 0 || t == 1) {
        tR = t;
    }
    else {
        let points2 = [];
        for (let p of points) {
            points2.push([p.x, p.y]);
        }
        let totalDistance = L.PlotUtils.wholeDistance(points2);

        let sum = 0;
        let index = 0;
        for (let i = 1; i < points2.length; i++) {
            let d = L.PlotUtils.distance(points2[i - 1], points2[i]);
            sum += d;
            if (sum >= totalDistance * t) {
                index = i;
                break;
            }
        }

        tR = index / points2.length;
    }

    // 参数约束处理(转换为全局位置)
    const totalSegments = points.length - 1;
    let tGlobal = Math.max(0, Math.min(tR, 1)) * totalSegments;
    tGlobal = Math.min(tGlobal, totalSegments - 1e-9); // 防止超出最后一个点

    // 创建镜像端点解决边界问题
    const first = points[0], last = points[points.length - 1];
    const extended = [
        { x: 2 * first.x - points[1].x, y: 2 * first.y - points[1].y },
        ...points,
        { x: 2 * last.x - points[points.length - 2].x, y: 2 * last.y - points[points.length - 2].y }
    ];

    // 确定当前曲线段
    const segIndex = Math.floor(tGlobal);
    const localT = tGlobal - segIndex;

    // 获取控制点集(调整索引偏移)
    const p0 = extended[segIndex];
    const p1 = extended[segIndex + 1];
    const p2 = extended[segIndex + 2];
    const p3 = extended[segIndex + 3];

    // 计算坐标点
    const t2 = localT * localT;
    const t3 = t2 * localT;
    const x = 0.5 * (
        (2 * p1.x) +
        (-p0.x + p2.x) * localT +
        (2 * p0.x - 5 * p1.x + 4 * p2.x - p3.x) * t2 +
        (-p0.x + 3 * p1.x - 3 * p2.x + p3.x) * t3
    );
    const y = 0.5 * (
        (2 * p1.y) +
        (-p0.y + p2.y) * localT +
        (2 * p0.y - 5 * p1.y + 4 * p2.y - p3.y) * t2 +
        (-p0.y + 3 * p1.y - 3 * p2.y + p3.y) * t3
    );

    // 计算切线向量
    const dx = 0.5 * (
        (-p0.x + p2.x) +
        2 * (2 * p0.x - 5 * p1.x + 4 * p2.x - p3.x) * localT +
        3 * (-p0.x + 3 * p1.x - 3 * p2.x + p3.x) * t2
    );
    const dy = 0.5 * (
        (-p0.y + p2.y) +
        2 * (2 * p0.y - 5 * p1.y + 4 * p2.y - p3.y) * localT +
        3 * (-p0.y + 3 * p1.y - 3 * p2.y + p3.y) * t2
    );

    return { x, y, dx, dy };
}
判断三点构成的曲线弯曲方向
如上图所示,圆圈需要根据曲线弯曲方向调整到曲线的一侧
/**
 * 判断三点构成的曲线弯曲方向
 * @param {Object} A - 起点坐标 [ number, number ]
 * @param {Object} B - 中间点坐标 [ number, number ]
 * @param {Object} C - 终点坐标 [ number, number ]
 * @returns {'left' | 'right' | 'straight'} 弯曲方向
 */
L.PlotUtils.determineCurveDirection = function (A, B, C) {
    // 计算向量AB和BC
    const abx = B[0] - A[0];
    const aby = B[1] - A[1];
    const bcx = C[0] - B[0];
    const bcy = C[1] - B[1];

    // 计算叉积 (AB × BC)
    const crossProduct = abx * bcy - aby * bcx;

    // 处理浮点数精度误差(阈值可调整)
    const epsilon = 1e-8;
    if (crossProduct > epsilon) return 'left';    // 逆时针方向
    if (crossProduct < -epsilon) return 'right';  // 顺时针方向
    return 'straight';  // 三点共线
}
svg图形旋转算法
不需要考虑曲线弯曲方向的情况
L.Plot.SplineCurve.prototype.getRotation = function (angle, scale, lineWidth) {
    let rotation = Math.atan2(angle.dy, angle.dx);
    rotation = -180 * rotation / Math.PI;
    let strokeWidth = lineWidth / scale;

    if (Math.abs(rotation) < 90) {
        transform = `transform: scale(${scale},${scale}); transform-origin: center right;`;
    } else {
        transform = `transform: scale(${scale},-${scale}); transform-origin: center right;`;
    }

    return { rotation, transform, strokeWidth }
}
需要考虑曲线弯曲方向的情况
L.Plot.SplineCurve.prototype.getRotation2 = function (angle, direction, scale, lineWidth) {
    let rotation = Math.atan2(angle.dy, angle.dx);
    rotation = -180 * rotation / Math.PI;
    let strokeWidth = lineWidth / scale;

    if (Math.abs(rotation) < 90) {
        if (direction == 'left') {
            rotation = 180 + rotation;
        }
        transform = `transform: scale(${scale},${scale}); transform-origin: center center;`;
    } else {
        if (direction == 'right') {
            rotation = 180 + rotation;
        }
        transform = `transform: scale(${scale},-${scale}); transform-origin: center center;`;
    }

    return { rotation, transform, strokeWidth }
}
标绘图形封装
基于样条曲线,可以实现多种同类标绘图形,这里实现了三种标绘图形
// 组合图形
L.Plot.CompositeGraphic = function (points, options) {
    this.points = points;
    this.options = {};
    Object.assign(this.options, options);
}
L.Plot.CompositeGraphic.prototype.convertLatLngs = function (points) {
    let pnts = [];
    for (let point of points) {
        pnts.push({ lat: point[0], lng: point[1] });
    }
    return pnts;
}
L.Plot.CompositeGraphic.prototype.getPointCount = function () {
    return this.points.length;
}
L.Plot.CompositeGraphic.prototype.getPoints = function () {
    return this.points;
}

// 样条曲线
L.Plot.SplineCurve = function (points, options) {
    L.Plot.CompositeGraphic.call(this, points, options); // 调用父类构造函数

    this.points = points;
    this.options = {
        fixPointCount: 6
    }
    Object.assign(this.options, options);
    this.type = L.PlotTypes.SPLINECURVE;
}
// 继承原型
L.Plot.SplineCurve.prototype = Object.create(L.Plot.CompositeGraphic.prototype);
L.Plot.SplineCurve.prototype.constructor = L.Plot.SplineCurve;
// 创建样条曲线
L.Plot.SplineCurve.prototype.create = function (map, plotLayer) {
    this.map = map;
    this.plotLayer = plotLayer;

    this.map.addEventListener("zoomend", this.mapZoomEnd, this);

    let polyline = L.polyline([], { color: this.options.color, opacity: this.options.opacity || 1 });
    this.plotLayer.addLayer(polyline);
    polyline.plot = this;
    this.polyline = polyline;
    this.layer = polyline;

    this.svgMarker = L.marker(this.points[0])
    this.svgMarker.setRotationOrigin('50% 50%');
    this.plotLayer.addLayer(this.svgMarker);

    this.arrowMarker = L.marker(this.points[0])
    this.arrowMarker.setRotationOrigin('50% 50%');
    this.plotLayer.addLayer(this.arrowMarker);

    let zoom = this.map.getZoom();
    let scale = Math.pow(1.2, (zoom - 14));
    this.updateIcons(scale);
}
// 地图放大缩小
L.Plot.SplineCurve.prototype.mapZoomEnd = function (e) {
    let zoom = this.map.getZoom();
    let scale = Math.pow(1.2, (zoom - 14));
    this.updateIcons(scale);
}
L.Plot.SplineCurve.prototype.setPoints = function (points) {
    this.points = points;
    if (this.points.length < 2) {
        return;
    }

    let proPoints = L.PlotUtils.proPoints(this.convertLatLngs(this.points));

    let pList = L.PlotUtils.getSplineCurve(proPoints);

    let latlngs = L.PlotUtils.unProPoints(pList);
    this.polyline.setLatLngs(latlngs);

    this.svgMarker.setLatLng(L.PlotUtils.unProPoint(pList[0]));
    this.arrowMarker.setLatLng(L.PlotUtils.unProPoint(pList[pList.length - 1]));

    let zoom = this.map.getZoom();
    let scale = Math.pow(1.2, (zoom - 14));
    this.updateIcons(scale);
}
L.Plot.SplineCurve.prototype.getRotation = function (angle, scale, lineWidth) {
    let rotation = Math.atan2(angle.dy, angle.dx);
    rotation = -180 * rotation / Math.PI;
    let strokeWidth = lineWidth / scale;

    if (Math.abs(rotation) < 90) {
        transform = `transform: scale(${scale},${scale}); transform-origin: center right;`;
    } else {
        transform = `transform: scale(${scale},-${scale}); transform-origin: center right;`;
    }

    return { rotation, transform, strokeWidth }
}
L.Plot.SplineCurve.prototype.getRotation2 = function (angle, direction, scale, lineWidth) {
    let rotation = Math.atan2(angle.dy, angle.dx);
    rotation = -180 * rotation / Math.PI;
    let strokeWidth = lineWidth / scale;

    if (Math.abs(rotation) < 90) {
        if (direction == 'left') {
            rotation = 180 + rotation;
        }
        transform = `transform: scale(${scale},${scale}); transform-origin: center center;`;
    } else {
        if (direction == 'right') {
            rotation = 180 + rotation;
        }
        transform = `transform: scale(${scale},-${scale}); transform-origin: center center;`;
    }

    return { rotation, transform, strokeWidth }
}
L.Plot.SplineCurve.prototype.updateIcons = function (scale) {
    let proPoints = L.PlotUtils.proPoints(this.convertLatLngs(this.points));

    let pList = L.PlotUtils.getSplineCurve(proPoints);

    // 切线
    let angle = L.PlotUtils.getSplineCurvePointAndTangent(pList, 0);

    this.updateSvgIcon(angle, scale);

    angle = L.PlotUtils.getSplineCurvePointAndTangent(pList, 1);
    this.updateArrowMarkerIcon(angle, scale * 0.3);
}
L.Plot.SplineCurve.prototype.updateSvgIcon = function (angle, scale) {
    let lineWidth = 2;
    let { rotation, transform, strokeWidth } = this.getRotation(angle, scale, lineWidth);

    // 显示svg图标
    let svgIcon = L.divIcon({
        html: `
        <div style="width:144px; height:144px; background:transparent;">
        <svg width="72" height="72" viewBox="0 0 72 72" fill="none" style="margin-left:0; margin-top:36px; ${transform}" xmlns="http://www.w3.org/2000/svg">

        <rect x="8" y="20" width="56" height="28" stroke="#FF0000" stroke-width="${strokeWidth}"/>
<path d="M59 20V48" stroke="#FF0000" stroke-width="${strokeWidth}"/>
<path d="M7 53H65" stroke="#FF0000" stroke-width="${strokeWidth}" stroke-linejoin="bevel"/>

        </svg>
        <div>
        `,
        className: 'plot-svg-marker',
        iconSize: [144, 144],  // 图标显示尺寸
        iconAnchor: [72, 72] // 图标锚点位置
    });
    this.svgMarker.setIcon(svgIcon);
    this.svgMarker.setRotationAngle(rotation);
}
L.Plot.SplineCurve.prototype.updateArrowMarkerIcon = function (angle, scale) {
    let lineWidth = 2;
    let { rotation, transform, strokeWidth } = this.getRotation(angle, scale, lineWidth);

    // 显示svg图标
    let svgIcon = L.divIcon({
        html: `
        <div style="width:144px; height:144px; background:transparent;">
        <svg width="72" height="72" viewBox="0 0 72 72" fill="none" style="margin-left:0; margin-top:36px; ${transform}" xmlns="http://www.w3.org/2000/svg">

            <path d="M0 0 L72 36 L0 72" stroke="#FF0000" stroke-width="${strokeWidth}" stroke-linejoin="bevel"/>

        </svg>
        <div>
        `,
        className: 'plot-svg-marker',
        iconSize: [144, 144],  // 图标显示尺寸
        iconAnchor: [72, 72] // 图标锚点位置
    });
    this.arrowMarker.setIcon(svgIcon);
    this.arrowMarker.setRotationAngle(rotation);
}
L.Plot.SplineCurve.prototype.finishDrawing = function () { }
// 释放资源
L.Plot.SplineCurve.prototype.dispose = function (e) {
    this.map.removeEventListener("zoomend", this.mapZoomEnd, this); // 注意:添加的时候传了this,移除的时候必需要传this,否则移除不掉
}

// 样条曲线 子类型1
L.Plot.SplineCurveSub1 = function (points, options) {
    L.Plot.SplineCurve.call(this, points, options); // 调用父类构造函数

    this.points = points;
    this.options = {
        fixPointCount: 6
    }
    Object.assign(this.options, options);
    this.type = L.PlotTypes.SPLINECURVE_SUB1;
}
// 继承原型
L.Plot.SplineCurveSub1.prototype = Object.create(L.Plot.SplineCurve.prototype);
L.Plot.SplineCurveSub1.prototype.constructor = L.Plot.SplineCurveSub1;
// 更新图标
L.Plot.SplineCurveSub1.prototype.updateIcons = function (scale) {
    let proPoints = L.PlotUtils.proPoints(this.convertLatLngs(this.points));

    let pList = L.PlotUtils.getSplineCurve(proPoints);

    // 切线
    let angle = L.PlotUtils.getSplineCurvePointAndTangent(pList, 0);

    this.updateSvgIcon(angle, scale);

    angle = L.PlotUtils.getSplineCurvePointAndTangent(pList, 1);
    this.updateArrowMarkerIcon(angle, scale * 0.3);
}
// 更新图标
L.Plot.SplineCurveSub1.prototype.updateSvgIcon = function (angle, scale) {
    let lineWidth = 2;
    let { rotation, transform, strokeWidth } = this.getRotation(angle, scale, lineWidth);

    // 显示svg图标
    let svgIcon = L.divIcon({
        html: `
        <div style="width:144px; height:144px; background:transparent;">
        <svg width="72" height="72" viewBox="0 0 72 72" fill="none" style="margin-left:0; margin-top:36px; ${transform}" xmlns="http://www.w3.org/2000/svg">

        <rect x="8" y="20" width="56" height="28" stroke="#FF0000" stroke-width="${strokeWidth}"/>
<path d="M59 20V48" stroke="#FF0000" stroke-width="${strokeWidth}"/>
<path d="M7 53H65" stroke="#FF0000" stroke-width="${strokeWidth}" stroke-linejoin="bevel"/>

        </svg>
        <div>
        `,
        className: 'plot-svg-marker',
        iconSize: [144, 144],  // 图标显示尺寸
        iconAnchor: [72, 72] // 图标锚点位置
    });
    this.svgMarker.setIcon(svgIcon);
    this.svgMarker.setRotationAngle(rotation);
}

// 样条曲线 子类型2
L.Plot.SplineCurveSub2 = function (points, options) {
    L.Plot.SplineCurve.call(this, points, options); // 调用父类构造函数

    this.points = points;
    this.options = {
        fixPointCount: 6
    }
    Object.assign(this.options, options);
    this.type = L.PlotTypes.SPLINECURVE_SUB2;
}
// 继承原型
L.Plot.SplineCurveSub2.prototype = Object.create(L.Plot.SplineCurve.prototype);
L.Plot.SplineCurveSub2.prototype.constructor = L.Plot.SplineCurveSub2;
// 更新图标
L.Plot.SplineCurveSub2.prototype.updateIcons = function (scale) {
    let proPoints = L.PlotUtils.proPoints(this.convertLatLngs(this.points));

    let pList = L.PlotUtils.getSplineCurve(proPoints);

    // 切线
    let angle = L.PlotUtils.getSplineCurvePointAndTangent(pList, 0);

    this.updateSvgIcon(angle, scale);

    angle = L.PlotUtils.getSplineCurvePointAndTangent(pList, 1);
    this.updateArrowMarkerIcon(angle, scale * 0.3);
}
// 更新图标
L.Plot.SplineCurveSub2.prototype.updateSvgIcon = function (angle, scale) {
    let lineWidth = 2;
    let { rotation, transform, strokeWidth } = this.getRotation(angle, scale, lineWidth);

    // 显示svg图标
    let svgIcon = L.divIcon({
        html: `
        <div style="width:144px; height:144px; background:transparent;">
        <svg width="72" height="72" viewBox="0 0 72 72" fill="none" style="margin-left:0; margin-top:36px; ${transform}" xmlns="http://www.w3.org/2000/svg">

        <rect x="8" y="21" width="56" height="30" stroke="#FF0000" stroke-width="${strokeWidth}"/>
        <path d="M48 27H24V45H48" stroke="#FF0000" stroke-width="${strokeWidth}"/>
        <path d="M29 36H43" stroke="#FF0000" stroke-width="${strokeWidth}"/>
        <path d="M36 43L36 29" stroke="#FF0000" stroke-width="${strokeWidth}"/>

        </svg>
        <div>
        `,
        className: 'plot-svg-marker',
        iconSize: [144, 144],  // 图标显示尺寸
        iconAnchor: [72, 72] // 图标锚点位置
    });
    this.svgMarker.setIcon(svgIcon);
    this.svgMarker.setRotationAngle(rotation);
}

// 样条曲线 子类型3
L.Plot.SplineCurveSub3 = function (points, options) {
    L.Plot.SplineCurve.call(this, points, options); // 调用父类构造函数

    this.points = points;
    this.options = {
        fixPointCount: 6
    }
    Object.assign(this.options, options);
    this.type = L.PlotTypes.SPLINECURVE_SUB3;
}
// 继承原型
L.Plot.SplineCurveSub3.prototype = Object.create(L.Plot.SplineCurve.prototype);
L.Plot.SplineCurveSub3.prototype.constructor = L.Plot.SplineCurveSub3;
// 创建样条曲线
L.Plot.SplineCurveSub3.prototype.create = function (map, plotLayer) {
    this.map = map;
    this.plotLayer = plotLayer;

    this.map.addEventListener("zoomend", this.mapZoomEnd, this);

    let polyline = L.polyline([], { color: this.options.color, opacity: this.options.opacity || 1 });
    this.plotLayer.addLayer(polyline);
    polyline.plot = this;
    this.polyline = polyline;
    this.layer = polyline;

    this.svgMarker = L.marker(this.points[0])
    this.svgMarker.setRotationOrigin('50% 50%');
    this.plotLayer.addLayer(this.svgMarker);

    this.arrowMarker = L.marker(this.points[0])
    this.arrowMarker.setRotationOrigin('50% 50%');
    this.plotLayer.addLayer(this.arrowMarker);

    this.circleMarker1 = L.marker(this.points[0])
    this.circleMarker1.setRotationOrigin('50% 50%');
    this.plotLayer.addLayer(this.circleMarker1);

    this.circleMarker2 = L.marker(this.points[0])
    this.circleMarker2.setRotationOrigin('50% 50%');
    this.plotLayer.addLayer(this.circleMarker2);

    this.marker3 = L.marker(this.points[0])
    this.marker3.setRotationOrigin('50% 50%');
    this.plotLayer.addLayer(this.marker3);

    let zoom = this.map.getZoom();
    let scale = Math.pow(1.2, (zoom - 14));
    this.updateIcons(scale);
}
// 更新图标
L.Plot.SplineCurveSub3.prototype.updateIcons = function (scale) {
    let proPoints = L.PlotUtils.proPoints(this.convertLatLngs(this.points));

    let pList = L.PlotUtils.getSplineCurve(proPoints);

    // 切线
    let angle = L.PlotUtils.getSplineCurvePointAndTangent(pList, 0);

    this.updateSvgIcon(angle, scale);

    angle = L.PlotUtils.getSplineCurvePointAndTangent(pList, 1);
    this.updateArrowMarkerIcon(angle, scale * 0.3);

    let direction = 'straight';
    if (proPoints.length >= 3) {
        direction = L.PlotUtils.determineCurveDirection(proPoints[proPoints.length - 3], proPoints[proPoints.length - 2], proPoints[proPoints.length - 1]);
    }

    angle = L.PlotUtils.getSplineCurvePointAndTangent(pList, 0.15);
    let lnglat = L.PlotUtils.unProPoint({ x: angle.x, y: angle.y });
    this.updateCircleIcon1(angle, direction, scale, lnglat);

    angle = L.PlotUtils.getSplineCurvePointAndTangent(pList, 0.3);
    lnglat = L.PlotUtils.unProPoint({ x: angle.x, y: angle.y });
    this.updateCircleIcon2(angle, direction, scale, lnglat);

    angle = L.PlotUtils.getSplineCurvePointAndTangent(pList, 0.8);
    lnglat = L.PlotUtils.unProPoint({ x: angle.x, y: angle.y });
    this.updateIcon3(angle, direction, scale, lnglat);
}
// 更新图标
L.Plot.SplineCurveSub3.prototype.updateSvgIcon = function (angle, scale) {
    let lineWidth = 2;
    let { rotation, transform, strokeWidth } = this.getRotation(angle, scale, lineWidth);

    // 显示svg图标
    let svgIcon = L.divIcon({
        html: `
        <div style="width:144px; height:144px; background:transparent;">
        <svg width="72" height="72" viewBox="0 0 72 72" fill="none" style="margin-left:0; margin-top:36px; ${transform}" xmlns="http://www.w3.org/2000/svg">

        <rect x="8" y="21" width="56" height="30" stroke="#FF0000" stroke-width="${strokeWidth}"/>
        <path d="M48 27H24V45H48" stroke="#FF0000" stroke-width="${strokeWidth}"/>
        <path d="M29 36H43" stroke="#FF0000" stroke-width="${strokeWidth}"/>
        <path d="M36 43L36 29" stroke="#FF0000" stroke-width="${strokeWidth}"/>

        </svg>
        <div>
        `,
        className: 'plot-svg-marker',
        iconSize: [144, 144],  // 图标显示尺寸
        iconAnchor: [72, 72] // 图标锚点位置
    });
    this.svgMarker.setIcon(svgIcon);
    this.svgMarker.setRotationAngle(rotation);
}
// 更新图标
L.Plot.SplineCurveSub3.prototype.updateCircleIcon1 = function (angle, direction, scale, lnglat) {
    let lineWidth = 2;
    let { rotation, transform, strokeWidth } = this.getRotation2(angle, direction, scale, lineWidth);

    // 显示svg图标
    let svgIcon = L.divIcon({
        html: `
        <div style="width:48px; height:48px; background:transparent;">
        <svg width="48" height="48" viewBox="0 0 48 48" fill="none" style="margin-left:0; margin-top:0; ${transform}" xmlns="http://www.w3.org/2000/svg">

        <circle cx="24" cy="38" r="8" stroke="red" stroke-width="${strokeWidth}" fill="none"/>

        </svg>
        <div>
        `,
        className: 'plot-svg-marker',
        iconSize: [48, 48],  // 图标显示尺寸
        iconAnchor: [24, 24] // 图标锚点位置
    });
    this.circleMarker1.setIcon(svgIcon);
    this.circleMarker1.setRotationAngle(rotation);
    this.circleMarker1.setLatLng(lnglat);
}
// 更新图标
L.Plot.SplineCurveSub3.prototype.updateCircleIcon2 = function (angle, direction, scale, lnglat) {
    let lineWidth = 2;
    let { rotation, transform, strokeWidth } = this.getRotation2(angle, direction, scale, lineWidth);

    // 显示svg图标
    let svgIcon = L.divIcon({
        html: `
        <div style="width:48px; height:48px; background:transparent;">
        <svg width="48" height="48" viewBox="0 0 48 48" fill="none" style="margin-left:0; margin-top:0; ${transform}" xmlns="http://www.w3.org/2000/svg">

        <circle cx="24" cy="38" r="8" stroke="red" stroke-width="${strokeWidth}" fill="none"/>

        </svg>
        </div>
        `,
        className: 'plot-svg-marker',
        iconSize: [48, 48],  // 图标显示尺寸
        iconAnchor: [24, 24] // 图标锚点位置
    });
    this.circleMarker2.setIcon(svgIcon);
    this.circleMarker2.setRotationAngle(rotation);
    this.circleMarker2.setLatLng(lnglat);
}
// 更新图标
L.Plot.SplineCurveSub3.prototype.updateIcon3 = function (angle, direction, scale, lnglat) {
    let lineWidth = 2;
    let { rotation, transform, strokeWidth } = this.getRotation2(angle, direction, scale, lineWidth);

    // 显示svg图标
    let svgIcon = L.divIcon({
        html: `
        <div style="width:48px; height:36px; background:transparent;">
        <svg width="48" height="36" viewBox="0 0 48 36" fill="none" style="margin-left:0; margin-top:0; ${transform}" xmlns="http://www.w3.org/2000/svg">

        <path d="M2 2 L2 34" stroke="#FF0000" stroke-width="${strokeWidth}" stroke-linejoin="bevel"/>
        <path d="M46 2 L46 34" stroke="#FF0000" stroke-width="${strokeWidth}" stroke-linejoin="bevel"/>

        </svg>
        </div>
        `,
        className: 'plot-svg-marker',
        iconSize: [48, 36],  // 图标显示尺寸
        iconAnchor: [24, 18] // 图标锚点位置
    });
    this.marker3.setIcon(svgIcon);
    this.marker3.setRotationAngle(rotation);
    this.marker3.setLatLng(lnglat);
}
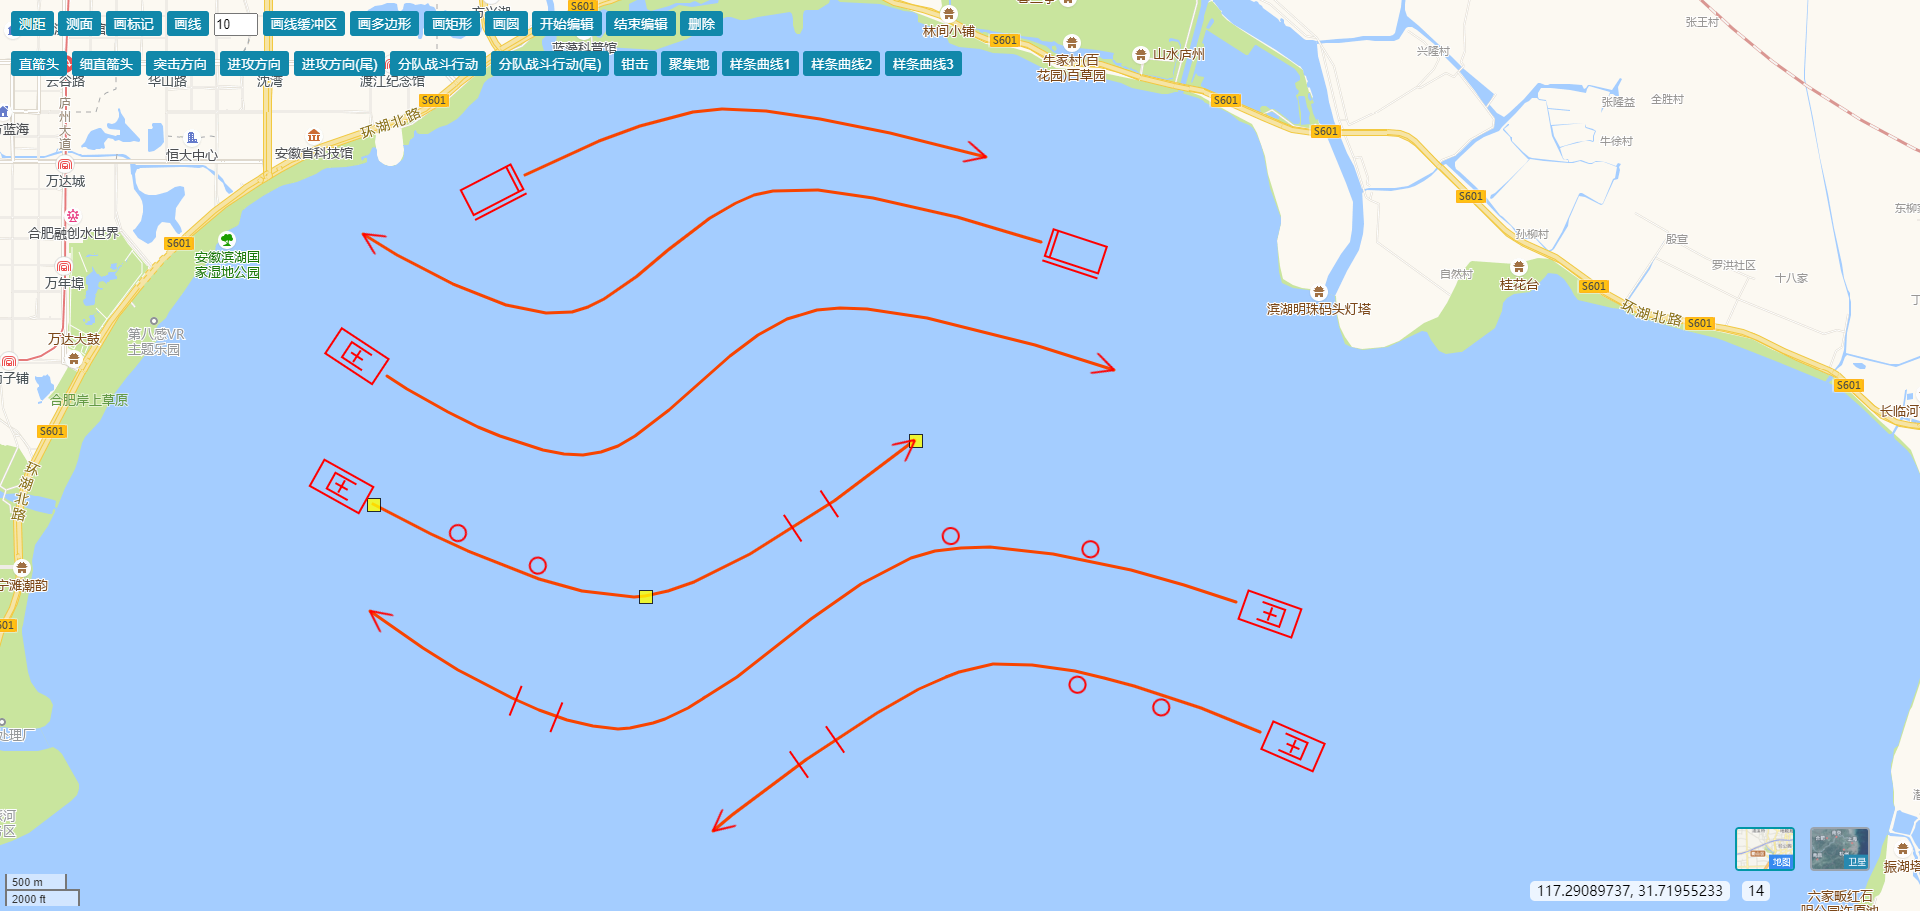
截图
源码地址
https://gitee.com/s0611163/leaflet-plot
来源链接:https://www.cnblogs.com/s0611163/p/18813137
© 版权声明
本站所有资源来自于网络,仅供学习与参考,请勿用于商业用途,否则产生的一切后果将由您(转载者)自己承担!
如有侵犯您的版权,请及时联系3500663466#qq.com(#换@),我们将第一时间删除本站数据。
如有侵犯您的版权,请及时联系3500663466#qq.com(#换@),我们将第一时间删除本站数据。
THE END


暂无评论内容