

代码github地址:
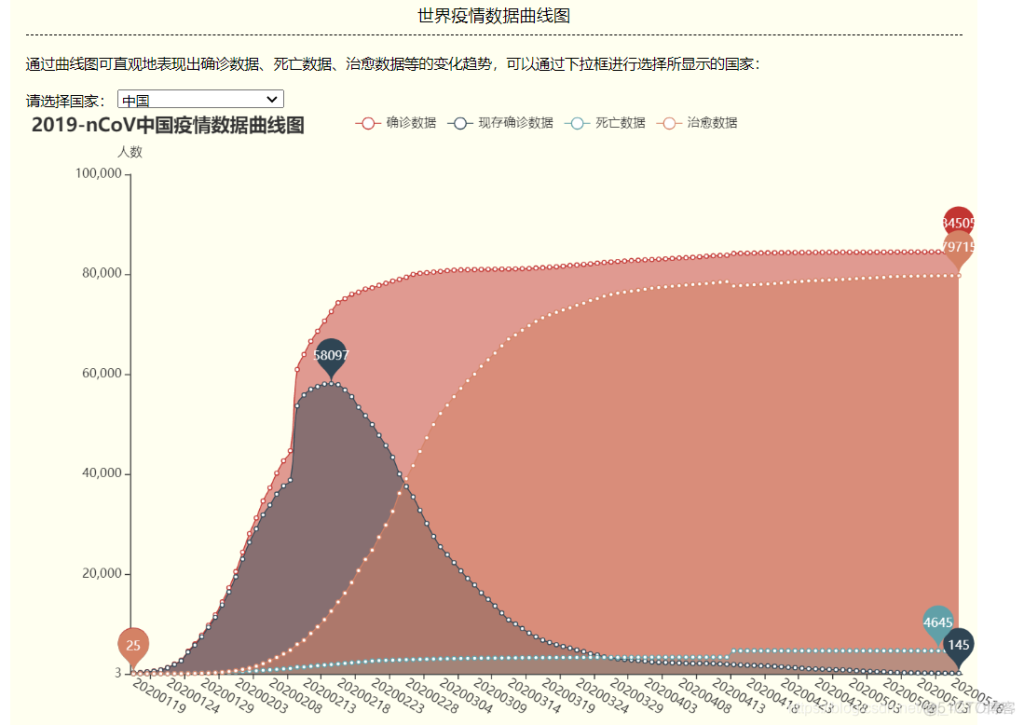
实现效果
具体实现效果可参照我的前一篇文章:
程序具体实现
数据存储与操作方式:
- 将湖北市域图形数据存储在shp文件中,通过加载shp按钮进行载入;
- 选择网易的疫情实时动态播报平台作为数据源,其地址如下:
https://wp.m.163.com/163/page/news/virus_report/index.html?nw=1&anw=1
通过爬虫请求获取数据(从1.1日至5.31日),经过数据清洗后保存为csv文件; - 在具有公网ip地址的 windows server 上搭建mysql数据库,将确诊人数数据存入数据库中,连接数据库获取确诊数据信息;可以便于后续在服务器上继续更新数据;
- 创建了DAO层,将数据库的增删改查等操作封装在工具类中,和具体程序业务逻辑分隔开来,其中包含了三个类:
-
SqlHelper:创建数据库连接、执行数据库命令、 创建MySqlDataReader对象:
其中定义的接口:public MySqlConnection getMySqlCon(); public int getMySqlCom(string M_str_sqlstr, params MySqlParameter[] parameters); public DataTable getMySqlRead(string M_str_sqlstr, params MySqlParameter[] parameters); -
sqlDataFormat:进行数据格式的修改:
其中定义的接口:public static string dataFormat(string str); -
OperateDatabase:定义了数据库增加、删除、修改、查找的接口;
其中定义的接口:public static int Insert(string TableName,ArrayList arr); public static DataTable select(string TableName, ArrayList arr); public static int Update(string TableName, ArrayList arr,ArrayList arr_where); public static int Delete(string TableName, ArrayList arr_where);
程序模块设计与文件组织:
程序可以分为以下几个模块:
- 辅助类:包含和数据库操作相关的DAO层、图例附加属性定义和日志模块;除了上述描述的数据操作类以外,还有:
- EnumMapSurroundType:图例附加属性定义类
- Log: 日志模块类
- 地图操作相关:主要包含地图操作(平移、缩放),地图渲染,以及地图导出等功能;
- Form1:地图展示和操作相关的实现;
- GisClass:包含了打开MXD文件、shp文件,以及地图渲染的一些辅助函数;
- 属性操作相关包含在地图上进行空间查询属性、在属性表中进行属性编辑等;
- Form1:属性表编辑和展示等操作
- SeletionForm:进行属性查询
- AddForm:添加数据
- 疫情数据统计模块:包含对疫情的统计图表生成操作;
- StaticsForm类
从界面美观的角度考虑,我们采用了DevExpress进行开发;DevExpress是一个比较有名的界面控件套件,提供了一系列的界面控件套件的DotNet界面控件。
窗口:
- 主窗体类为
Form1.cs; - 进行属性查询选择窗体类为
SeletionForm.cs - 统计图表类为
StaticsForm.cs - 添加数据类为
AddForm.cs
主要功能实现流程与方法
- 地图展示和常规地图操作:
- 采用ArcEngine的mapControl控件进行地图展示:
- 采用ArcEngine的ToolbarControl控件完成常规的地图操作,如放大、缩小、平移、全图;
- 加载shp/mxd文件:
- 打开mxd文件:
private void openMxd_ItemClick(object sender, DevExpress.XtraBars.ItemClickEventArgs e) { String MxdPath=GisClass.OpenMxd(); axMapControl1.LoadMxFile(MxdPath); } public static string OpenMxd() { string MxdPath = ""; OpenFileDialog OpenMXD = new OpenFileDialog(); OpenMXD.Title = "打开地图"; OpenMXD.InitialDirectory = "E:"; OpenMXD.Filter = "Map Documents (*.mxd)|*.mxd"; if (OpenMXD.ShowDialog() == DialogResult.OK) { MxdPath = OpenMXD.FileName; } return MxdPath; }
打开shp文件:public static string[] OpenShapeFile() { string[] ShpFile = new string[2]; OpenFileDialog OpenShpFile = new OpenFileDialog(); OpenShpFile.Title = "打开Shape文件"; OpenShpFile.InitialDirectory = "E:"; OpenShpFile.Filter = "Shape文件(*.shp)|*.shp"; if (OpenShpFile.ShowDialog() == DialogResult.OK) { string ShapPath = OpenShpFile.FileName; //利用"\\"将文件路径分成两部分 int Position = ShapPath.LastIndexOf("\\"); string FilePath = ShapPath.Substring(0, Position); string ShpName = ShapPath.Substring(Position + 1); ShpFile[0] = FilePath; ShpFile[1] = ShpName; } else { return null; } return ShpFile; } - 每日疫情分布显示:
- 通过打开shp文件按钮加载
市域.shp,再遍历图层获取湖北市域空间数据;如未加载,系统会报错如下:
//遍历,寻找市域图层
for (int i = 0; i < this.axMapControl1.Map.LayerCount; i++) {
ILayer layer1 = this.axMapControl1.Map.get_Layer(i);
if (layer1.Name == "市域")
            {
layer = layer1 as IFeatureLayer;
break;
            }
        }
if (layer == null) {
MessageBox.Show("请打开市域图层");
return;
        }
- 点击每日疫情按钮,首先获取图层的相应字段,然后根据选择的日期在数据库中进行查询,获取疫情数据;
//获取图层字段,没有则添加一个num字段
IFeatureClass featureClass = layer.FeatureClass;
int isExist=featureClass.FindField("num");
if (isExist == -1) {
//添加一个字段
IFields pFields = featureClass.Fields;
IFieldsEdit pFieldsEdit = pFields as IFieldsEdit;
IField fld = new FieldClass();
IFieldEdit2 fldE = fld as IFieldEdit2;
fldE.Name_2 = "num";
fldE.AliasName_2 = "数量";
fldE.Type_2 = esriFieldType.esriFieldTypeSingle;
featureClass.AddField(fld);
        }
//给字段赋值
IFeatureCursor pFtCursor = featureClass.Search(null, false);
IFeature pFt = pFtCursor.NextFeature();
int index1 = pFt.Fields.FindField("num");
IDataset dataset = (IDataset)featureClass;
IWorkspace workspace = dataset.Workspace;
IWorkspaceEdit workspaceEdit = (IWorkspaceEdit)workspace;
workspaceEdit.StartEditing(true);
workspaceEdit.StartEditOperation();
while (pFt != null) {
int index = pFt.Fields.FindField("code");
String code = pFt.get_Value(index).ToString();

DataRow[] drs=dt.Select("CODE=" + code);
DataTable dtNew = dt.Clone();
for (int i = 0; i < drs.Length; i++)
            {
dtNew.ImportRow(drs[i]);

            }
String num = dtNew.Rows[0]["AllConfiemed"].ToString();
if (num == "") {
num = "0";
            }

pFt.set_Value(index1,  Convert.ToInt32(num));
pFt.Store();
pFt = pFtCursor.NextFeature();
        }
- 根据获取的数据对图层进行渲染
GisClass.ClassRender(this.axMapControl1.ActiveView, layer, 6, "num");
- 空间查询操作:
- 通过点击图形按钮,绘制多边形、圆、矩形等;
- 如绘制多边形:先设置绘制类型为多边形,再创建一个多边形元素,设置相应属性,在pGraphicsContainer中添加该多边形;然后鼠标点击时追踪多边形,并局部刷新map
private void drawPolygon_ItemClick(object sender, DevExpress.XtraBars.ItemClickEventArgs e) { this.type = 1; IPolygonElement polygonElement = new PolygonElementClass(); pElement = polygonElement as IElement; ISimpleFillSymbol simpleFill = new SimpleFillSymbolClass(); simpleFill.Style = esriSimpleFillStyle.esriSFSNull; simpleFill.Color = GisClass.GetRgbColor(255,0,0); //设置边线颜色 ILineSymbol lineSymbol = new SimpleLineSymbol(); lineSymbol.Color = GisClass.GetRgbColor(255, 0, 0); IFillShapeElement shapeEle = pElement as IFillShapeElement; simpleFill.Outline = lineSymbol; shapeEle.Symbol = simpleFill; pGraphicsContainer.AddElement(pElement, 0); } private void axMapControl1_OnMouseDown(object sender, IMapControlEvents2_OnMouseDownEvent e{ ....... if (this.type == 1) { IGeometry Polygon = axMapControl1.TrackPolygon(); pElement.Geometry = Polygon; axMapControl1.ActiveView.PartialRefresh(esriViewDrawPhase.esriViewBackground, null, null); } ...... }
- 通过点击查询,对所选范围执行空间查询操作,对地图上查询到的部分进行高亮显示;
private void query_btn_ItemClick(object sender, DevExpress.XtraBars.ItemClickEventArgs e)
    {
ArrayList arr = new ArrayList();
DataTable dt = OperateDatabase.select("data", arr);
this.gridControl1.DataSource = dt;
this.tabControl2.SelectedIndex = 1;
    }
- 点击进行属性查询,打开属性表;
private void shapeQuery_ItemClick(object sender, DevExpress.XtraBars.ItemClickEventArgs e)
    {
axMapControl1.Map.ClearSelection();
IGraphicsContainer graphicsContainer = axMapControl1.Map as IGraphicsContainer;
graphicsContainer.Reset();
IElement element = graphicsContainer.Next();
//获取图形几何信息
if (element == null) {
MessageBox.Show("请在工具栏选择绘制矩形,多边形,或者圆");
return;
        }
IGeometry geometry = element.Geometry;
axMapControl1.Map.SelectByShape(geometry,null,false);
//进行部分刷新显示最新要素
axMapControl1.ActiveView.PartialRefresh(esriViewDrawPhase.esriViewGeoSelection,null,axMapControl1.ActiveView.Extent);
    }
- 属性数据编辑:
- 在属性数据的页面中,可以点击查询、增加、删除等按钮进行属性数据的编辑;
- 修改单元格内容:
//获取修改的单元格 string CellValue = this.gridView1.GetFocusedValue().ToString(); //获取单元格的列名 string ColumnName = this.gridView1.FocusedColumn.FieldName; //获取所在列的id DataRow dr = this.gridView1.GetDataRow(e.RowHandle); string id = dr["id"].ToString(); //修改 ArrayList arr = new ArrayList(); if (ColumnName == "name" || ColumnName == "YMD") { arr.Add(ColumnName + ":'" + CellValue + "'"); } else { arr.Add(ColumnName + ":" + CellValue); } ArrayList arr_where = new ArrayList(); arr_where.Add("id:" + id); int result = OperateDatabase.Update("data", arr, arr_where); if (result == 0) { MessageBox.Show("该值修改失败"); }
添加数据:private void add_btn_Click(object sender, EventArgs e) { ArrayList arr = new ArrayList(); arr.Add("code:"+this.textBox_code.Text); arr.Add("name:'" + this.textBox_name.Text+"'"); arr.Add("YMD:'" + this.date_edit.Text+"'"); arr.Add("AllConfiemed:" + this.spinEdit_AllConfiemed.Text); arr.Add("CurConfirmeed:" + this.spinEdit_CurConfirmeed.Text); arr.Add("Cured:" + this.spinEdit_Cured.Text); arr.Add("Death:" + this.spinEdit_Death.Text); int result = OperateDatabase.Insert("data",arr); if (result == 1) { MessageBox.Show("添加成功"); return; }else { MessageBox.Show("添加失败"); return; } }
属性查询结果:
在属性查询结果中是以树的方式展示不同图层的查询结果:private void treeView1_NodeMouseClick(object sender, TreeNodeMouseClickEventArgs e) { this.gridView1.Columns.Clear(); currentLayer = e.Node.Tag as IFeatureLayer; if (currentLayer == null) { return; } IFeatureSelection featureSelection = currentLayer as IFeatureSelection; //获取选中得要素几何 ISelectionSet selectionSet = featureSelection.SelectionSet; //获取字段 IFields fields = currentLayer.FeatureClass.Fields; DataTable dt = new DataTable(); for (int i = 0; i < fields.FieldCount; i++) { dt.Columns.Add(fields.get_Field(i).Name); } //获取整个数据集 ICursor cursor; selectionSet.Search(null,false,out cursor); //获取每个要素 IFeatureCursor featureCursor = cursor as IFeatureCursor; //遍历 IFeature feature = featureCursor.NextFeature(); String[] strs; while (feature != null) { strs = new String[fields.FieldCount]; for (int i = 0; i < fields.FieldCount; i++) { strs[i] = feature.get_Value(i).ToString(); } dt.Rows.Add(strs); feature = featureCursor.NextFeature(); } this.gridControl1.DataSource = dt; } - 疫情统计:
- 在主页面上点击疫情统计,可显示查询窗口,其中可完成对于疫情统计图表的生成和查看;
private void statics_btn_Click(object sender, EventArgs e)
    {
//查询起始日期的数字
if (this.dateEdit_start.Text == "" || this.dateEdit_target.Text == "") {
MessageBox.Show("请填写起止日期");
return;
        }
ArrayList arr1 = new ArrayList();
arr1.Add("YMD:'" + this.dateEdit_start.Text + "'");
DataTable dt1 = OperateDatabase.select("data",arr1);
ArrayList arr2 = new ArrayList();
arr1.Add("YMD:'" + this.dateEdit_target.Text + "'");
DataTable dt2 = OperateDatabase.select("data", arr1);
Series s1 = this.chartControl1.Series[0];
s1.DataSource = dt1;
s1.ArgumentDataMember = "name";
s1.ValueDataMembers[0] = "CurConfirmeed";
    }
- 轨迹分析:
- 通过日期框进行日期区间的选择;
- 轨迹数据已存放在数据库中,通过sql查询载入轨迹数据:
- 进行轨迹查询:
- 绘制轨迹:
if (this.start_time.EditValue == "" || this.end_time.EditValue == "") {
MessageBox.Show("请选择起止日期");
return;
        }
SqlHelper help = new SqlHelper();
String sql = "select * from route where tm between '" + this.start_time.EditValue + "' and '" + this.end_time.EditValue+"'";
DataTable dt = help.getMySqlRead(sql);
ISimpleMarkerSymbol simpleMarkerSymbol = new SimpleMarkerSymbol();
simpleMarkerSymbol.Style = esriSimpleMarkerStyle.esriSMSCircle;
IColor color = GisClass.GetRgbColor(0,255,0);
simpleMarkerSymbol.Color = color;
ILineElement lineElement = new LineElementClass();
IElement ele1 = lineElement as IElement;
ISegment pSegment;
ILine pLine=null;
object o = Type.Missing;
ISegmentCollection pPath = new PathClass();
for (int i = 0; i < dt.Rows.Count; i++) {

IMarkerElement markerEle = new MarkerElementClass();
IElement ele=markerEle as IElement;
IPoint point = new PointClass();
markerEle.Symbol = simpleMarkerSymbol;
point.PutCoords(Double.Parse(dt.Rows[i]["x"].ToString()),Double.Parse(dt.Rows[i]["y"].ToString()));
ele.Geometry = point;
pGraphicsContainer.AddElement(ele,0);
//逐段添加线
if (i > 0 && i < dt.Rows.Count) {
IPoint point1 = new PointClass();
point1.PutCoords(Double.Parse(dt.Rows[i-1]["x"].ToString()), Double.Parse(dt.Rows[i-1]["y"].ToString()));
pLine = new LineClass();
pLine.PutCoords(point1, point);
pSegment = pLine as ISegment;
pPath.AddSegment(pSegment, ref o, ref o);
            }


axMapControl1.ActiveView.PartialRefresh(esriViewDrawPhase.esriViewBackground, null, null);
        }
IGeometryCollection pPolyline = new PolylineClass();
pPolyline.AddGeometry(pPath as IGeometry, ref o, ref o);
IPolyline polyline = pPolyline as IPolyline;
//获取范围
IEnvelope ev = polyline.Envelope;
this.axMapControl1.ActiveView.Extent = ev;
ele1.Geometry = pPolyline as IPolyline;
pGraphicsContainer.AddElement(ele1, 0);
- 每日疫情图输出:
- 添加图例:可为地图添加指北针、比例尺等;
- 添加指北针:
void addNorthArrow(IPageLayout pPageLayout, IEnvelope pEnv, IActiveView pActiveView) { if (pPageLayout == null || pActiveView == null) { return; } ESRI.ArcGIS.esriSystem.IUID uid = new ESRI.ArcGIS.esriSystem.UIDClass(); uid.Value = "esriCarto.MarkerNorthArrow"; ESRI.ArcGIS.Carto.IGraphicsContainer graphicsContainer = pPageLayout as ESRI.ArcGIS.Carto.IGraphicsContainer; ESRI.ArcGIS.Carto.IActiveView activeView = pPageLayout as ESRI.ArcGIS.Carto.IActiveView; ESRI.ArcGIS.Carto.IFrameElement frameElement = graphicsContainer.FindFrame(pActiveView.FocusMap); ESRI.ArcGIS.Carto.IMapFrame mapFrame = frameElement as ESRI.ArcGIS.Carto.IMapFrame; // Dynamic Cast ESRI.ArcGIS.Carto.IMapSurroundFrame mapSurroundFrame = mapFrame.CreateSurroundFrame(uid as ESRI.ArcGIS.esriSystem.UID, null); // Dynamic Cast ESRI.ArcGIS.Carto.IElement element = mapSurroundFrame as ESRI.ArcGIS.Carto.IElement; // Dynamic Cast element.Geometry = pEnv; element.Activate(activeView.ScreenDisplay); graphicsContainer.AddElement(element, 0); ESRI.ArcGIS.Carto.IMapSurround mapSurround = mapSurroundFrame.MapSurround; // Change out the default north arrow ESRI.ArcGIS.Carto.IMarkerNorthArrow markerNorthArrow = mapSurround as ESRI.ArcGIS.Carto.IMarkerNorthArrow; // Dynamic Cast ESRI.ArcGIS.Display.IMarkerSymbol markerSymbol = markerNorthArrow.MarkerSymbol; ESRI.ArcGIS.Display.ICharacterMarkerSymbol characterMarkerSymbol = markerSymbol as ESRI.ArcGIS.Display.ICharacterMarkerSymbol; // Dynamic Cast characterMarkerSymbol.CharacterIndex = 200; // change the symbol for the North Arrow markerNorthArrow.MarkerSymbol = characterMarkerSymbol; }
添加比例尺:public void makeScaleBar(IActiveView pActiveView, IPageLayout pPageLayout, IEnvelope pEnv) { IGraphicsContainer container = pPageLayout as IGraphicsContainer; // 获得MapFrame IFrameElement frameElement = container.FindFrame(pActiveView.FocusMap); IMapFrame mapFrame = frameElement as IMapFrame; //根据MapSurround的uid,创建相应的MapSurroundFrame和MapSurround UID uid = new UIDClass(); uid.Value = "esriCarto.AlternatingScaleBar"; IMapSurroundFrame mapSurroundFrame = mapFrame.CreateSurroundFrame(uid, null); //设置MapSurroundFrame中比例尺的样式 IMapSurround mapSurround = mapSurroundFrame.MapSurround; IScaleBar markerScaleBar = ((IScaleBar)mapSurround); markerScaleBar.LabelPosition = esriVertPosEnum.esriBelow; markerScaleBar.UseMapSettings(); //QI,确定mapSurroundFrame的位置 IElement element = mapSurroundFrame as IElement; element.Geometry = pEnv; //使用IGraphicsContainer接口添加显示 container.AddElement(element, 0); pActiveView.Refresh(); } #endregion
- 点击输出按钮,可将疫情图输出为多种格式:
如导出为图片:
private void ExportMapToImage()
    {
try
        {
SaveFileDialog pSaveDialog = new SaveFileDialog();
pSaveDialog.FileName = "";
pSaveDialog.Filter = "JPG图片(*.JPG)|*.jpg|tif图片(*.tif)|*.tif|PDF文档(*.PDF)|*.pdf";
if (pSaveDialog.ShowDialog() == DialogResult.OK)
            {
double iScreenDispalyResolution =this.axPageLayoutControl1.ActiveView.ScreenDisplay.DisplayTransformation.Resolution;// 获取屏幕分辨率的值
IExporter pExporter = null;
if (pSaveDialog.FilterIndex == 1)
                {
pExporter = new JpegExporterClass();
                }
else if (pSaveDialog.FilterIndex == 2)
                {
pExporter = new TiffExporterClass();
                }
else if (pSaveDialog.FilterIndex == 3)
                {
pExporter = new PDFExporterClass();
                }
pExporter.ExportFileName = pSaveDialog.FileName;
pExporter.Resolution = (short)iScreenDispalyResolution; //分辨率
tagRECT deviceRect = this.axPageLayoutControl1.ActiveView.ScreenDisplay.DisplayTransformation.get_DeviceFrame();
IEnvelope pDeviceEnvelope = new EnvelopeClass();
pDeviceEnvelope.PutCoords(deviceRect.left, deviceRect.bottom, deviceRect.right, deviceRect.top);
pExporter.PixelBounds = pDeviceEnvelope; // 输出图片的范围
ITrackCancel pCancle = new CancelTrackerClass();//可用ESC键取消操作
this.axPageLayoutControl1.ActiveView.Output(pExporter.StartExporting(), pExporter.Resolution, ref deviceRect, this.axPageLayoutControl1.ActiveView.Extent, pCancle);
Application.DoEvents();
pExporter.FinishExporting();
            }

        }
catch (Exception Err)
        {
MessageBox.Show(Err.Message, "输出图片", MessageBoxButtons.OK, MessageBoxIcon.Information);
        }
    }
除了导出为图片之外,支持多种其他格式,如pdf、jpg等
© 版权声明
本站所有资源来自于网络,仅供学习与参考,请勿用于商业用途,否则产生的一切后果将由您(转载者)自己承担!
如有侵犯您的版权,请及时联系3500663466#qq.com(#换@),我们将第一时间删除本站数据。
如有侵犯您的版权,请及时联系3500663466#qq.com(#换@),我们将第一时间删除本站数据。
THE END


暂无评论内容