

说明:
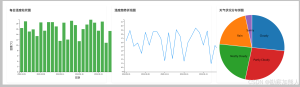
vue+d3js+fastapi实现天气柱状图折线图饼图
效果图:

step0:postman
1. 生成天气数据(POST请求):
URL: http://localhost:8000/generate-data/?year=2024&month=3&seed=42
方法: POST
Headers:
  Content-Type: application/json
成功响应示例:
{
    "status": "success",
    "message": "成功生成31条天气数据",
    "year": 2024,
    "month": 3
}
2. 查询天气数据(GET请求):
URL: http://localhost:8000/weather-data/?year=2024&month=4
方法: GET
成功响应示例:
{
    "status": "success",
    "count": 31,
    "year": 2024,
    "month": 3,
    "data": [
        {
            "record_date": "2024-03-01",
            "temperature": 16.4,
            "humidity": 72,
            "precipitation": 0.0,
            "wind_speed": 7.2,
            "weather_condition": "Cloudy"
        },

        {
            "record_date": "2024-03-31",
            "temperature": 17.3,
            "humidity": 62,
            "precipitation": 3.8,
            "wind_speed": 1.4,
            "weather_condition": "Rain"
        }
    ]
}
step1:sql
CREATE TABLE weather_data (
    id INT AUTO_INCREMENT PRIMARY KEY,
    record_date DATE NOT NULL,
    temperature DECIMAL(4,1) NOT NULL,  -- 格式:-99.9 到 99.9
    humidity TINYINT UNSIGNED NOT NULL,  -- 范围:0-100
    precipitation DECIMAL(5,1) NOT NULL, -- 最大999.9mm
    wind_speed DECIMAL(4,1) NOT NULL,   -- 最大99.9m/s
    weather_condition VARCHAR(50) NOT NULL,  -- 修改列名
    INDEX (record_date)
) ENGINE=InnoDB DEFAULT CHARSET=utf8mb4;

select *from weather_data;
step2:python test
C:\Users\wangrusheng\PycharmProjects\FastAPIProject1\hello.py
import random
from datetime import date
from decimal import Decimal
import calendar
import pymysql.cursors
import json
# 数据库配置(根据实际情况修改)
DB_CONFIG = {
    'host': 'localhost',
    'user': 'root',
    'password': '123456',
    'db': 'db_school',
    'charset': 'utf8mb4',
    'cursorclass': pymysql.cursors.DictCursor
}


def generate_temperature(rng, min_temp=10.0, max_temp=20.0):
    """生成温度数据(均匀分布)"""
    temp = rng.uniform(min_temp, max_temp)
    return round(temp, 1)


def generate_humidity(rng):
    """生成湿度数据(正态分布)"""
    humidity = rng.gauss(60, 15)
    humidity = max(0, min(humidity, 100))
    return int(round(humidity))


def generate_precipitation(rng):
    """生成降水量数据(20%概率下雨)"""
    if rng.random() < 0.2:
        amount = rng.expovariate(1 / 5.0)  # 平均5mm
        amount = max(0.1, min(amount, 30.0))
        return round(amount, 1)
    return 0.0


def generate_wind_speed(rng):
    """生成风速数据(伽马分布)"""
    speed = rng.gammavariate(2, 2)
    speed = max(0.0, min(speed, 20.0))
    return round(speed, 1)


def get_weather_condition(temperature, precipitation, humidity, rng):
    """根据天气参数判断天气状况"""
    if precipitation > 0:
        return 'Snow' if temperature < 3.0 else 'Rain'
    if humidity >= 70:
        return 'Cloudy'
    if humidity <= 30:
        return 'Sunny'
    return rng.choice(['Partly Cloudy', 'Mostly Cloudy'])


def generate_monthly_weather_data(year, month, rng=None):
    """生成整月天气数据"""
    if rng is None:
        rng = random.Random()

    _, num_days = calendar.monthrange(year, month)
    data = []

    for day in range(1, num_days + 1):
        record_date = date(year, month, day)
        temperature = generate_temperature(rng)
        humidity = generate_humidity(rng)
        precipitation = generate_precipitation(rng)
        wind_speed = generate_wind_speed(rng)
        condition = get_weather_condition(
            temperature, precipitation, humidity, rng
        )

        data.append({
            'record_date': record_date,
            'temperature': temperature,
            'humidity': humidity,
            'precipitation': precipitation,
            'wind_speed': wind_speed,
            'weather_condition': condition
        })

    return data


def insert_weather_data(data):
    """批量插入天气数据到数据库"""
    connection = pymysql.connect(**DB_CONFIG)
    try:
        with connection.cursor() as cursor:
            sql = """
                INSERT INTO weather_data
                (record_date, temperature, humidity, precipitation, wind_speed, weather_condition)
                VALUES (%s, %s, %s, %s, %s, %s)
            """
            params = [
                (
                    d['record_date'],
                    d['temperature'],
                    d['humidity'],
                    d['precipitation'],
                    d['wind_speed'],
                    d['weather_condition']
                )
                for d in data
            ]
            cursor.executemany(sql, params)
        connection.commit()
        return len(data)
    except Exception as e:
        connection.rollback()
        raise e
    finally:
        connection.close()


def get_weather_data(year: int, month: int) -> list:
    """从数据库获取指定年月的天气数据并转换为JSON兼容格式"""
    connection = pymysql.connect(**DB_CONFIG)
    try:
        with connection.cursor() as cursor:
            sql = """
                SELECT record_date, temperature, humidity,
                       precipitation, wind_speed, weather_condition
                FROM weather_data
                WHERE YEAR(record_date) = %s AND MONTH(record_date) = %s
                ORDER BY record_date
            """
            cursor.execute(sql, (year, month))
            results = cursor.fetchall()

            # 转换日期和数值类型
            for record in results:
                record['record_date'] = record['record_date'].isoformat()
                # 处理Decimal类型(如果存在)
                for key in ['temperature', 'precipitation', 'wind_speed']:
                    if isinstance(record[key], Decimal):
                        record[key] = float(record[key])
            return results
    finally:
        connection.close()


if __name__ == '__main__':
    # 示例:生成并插入2024年4月的天气数据
    year = 2024
    month = 4

    # 创建带种子的随机生成器(保证结果可复现)
    rng = random.Random(42)

    try:
        # 生成模拟数据
        weather_data = generate_monthly_weather_data(year, month, rng)

        # 插入数据库
        # inserted_count = insert_weather_data(weather_data)
        # print(f"成功插入{inserted_count}条天气数据")
        # 获取并打印JSON数据
        weather_json = get_weather_data(year, month)
        print(json.dumps(weather_json, indent=2, ensure_ascii=False))

    except Exception as e:
        print(f"操作失败: {str(e)}")
step3:python fastapi
C:\Users\wangrusheng\PycharmProjects\FastAPIProject1\main.py
from fastapi import FastAPI, HTTPException, Query
from datetime import date
from decimal import Decimal
from typing import Optional
import random
import calendar
import pymysql.cursors
import json
from fastapi.middleware.cors import CORSMiddleware
app = FastAPI()
# CORS配置
app.add_middleware(
    CORSMiddleware,
    allow_origins=["*"],
    allow_credentials=True,
    allow_methods=["*"],
    allow_headers=["*"],
)
# 数据库配置(根据实际情况修改)
DB_CONFIG = {
    'host': 'localhost',
    'user': 'root',
    'password': '123456',
    'db': 'db_school',
    'charset': 'utf8mb4',
    'cursorclass': pymysql.cursors.DictCursor
}

# 以下保持原有函数定义不变(generate_temperature、generate_humidity等)
# [原有函数定义区,保持与问题中完全相同的函数实现]


def generate_temperature(rng, min_temp=10.0, max_temp=20.0):
    """生成温度数据(均匀分布)"""
    temp = rng.uniform(min_temp, max_temp)
    return round(temp, 1)


def generate_humidity(rng):
    """生成湿度数据(正态分布)"""
    humidity = rng.gauss(60, 15)
    humidity = max(0, min(humidity, 100))
    return int(round(humidity))


def generate_precipitation(rng):
    """生成降水量数据(20%概率下雨)"""
    if rng.random() < 0.2:
        amount = rng.expovariate(1 / 5.0)  # 平均5mm
        amount = max(0.1, min(amount, 30.0))
        return round(amount, 1)
    return 0.0


def generate_wind_speed(rng):
    """生成风速数据(伽马分布)"""
    speed = rng.gammavariate(2, 2)
    speed = max(0.0, min(speed, 20.0))
    return round(speed, 1)


def get_weather_condition(temperature, precipitation, humidity, rng):
    """根据天气参数判断天气状况"""
    if precipitation > 0:
        return 'Snow' if temperature < 3.0 else 'Rain'
    if humidity >= 70:
        return 'Cloudy'
    if humidity <= 30:
        return 'Sunny'
    return rng.choice(['Partly Cloudy', 'Mostly Cloudy'])


def generate_monthly_weather_data(year, month, rng=None):
    """生成整月天气数据"""
    if rng is None:
        rng = random.Random()

    _, num_days = calendar.monthrange(year, month)
    data = []

    for day in range(1, num_days + 1):
        record_date = date(year, month, day)
        temperature = generate_temperature(rng)
        humidity = generate_humidity(rng)
        precipitation = generate_precipitation(rng)
        wind_speed = generate_wind_speed(rng)
        condition = get_weather_condition(
            temperature, precipitation, humidity, rng
        )

        data.append({
            'record_date': record_date,
            'temperature': temperature,
            'humidity': humidity,
            'precipitation': precipitation,
            'wind_speed': wind_speed,
            'weather_condition': condition
        })

    return data


def insert_weather_data(data):
    """批量插入天气数据到数据库"""
    connection = pymysql.connect(**DB_CONFIG)
    try:
        with connection.cursor() as cursor:
            sql = """
                INSERT INTO weather_data
                (record_date, temperature, humidity, precipitation, wind_speed, weather_condition)
                VALUES (%s, %s, %s, %s, %s, %s)
            """
            params = [
                (
                    d['record_date'],
                    d['temperature'],
                    d['humidity'],
                    d['precipitation'],
                    d['wind_speed'],
                    d['weather_condition']
                )
                for d in data
            ]
            cursor.executemany(sql, params)
        connection.commit()
        return len(data)
    except Exception as e:
        connection.rollback()
        raise e
    finally:
        connection.close()


def get_weather_data(year: int, month: int) -> list:
    """从数据库获取指定年月的天气数据并转换为JSON兼容格式"""
    connection = pymysql.connect(**DB_CONFIG)
    try:
        with connection.cursor() as cursor:
            sql = """
                SELECT record_date, temperature, humidity,
                       precipitation, wind_speed, weather_condition
                FROM weather_data
                WHERE YEAR(record_date) = %s AND MONTH(record_date) = %s
                ORDER BY record_date
            """
            cursor.execute(sql, (year, month))
            results = cursor.fetchall()

            # 转换日期和数值类型
            for record in results:
                record['record_date'] = record['record_date'].isoformat()
                # 处理Decimal类型(如果存在)
                for key in ['temperature', 'precipitation', 'wind_speed']:
                    if isinstance(record[key], Decimal):
                        record[key] = float(record[key])
            return results
    finally:
        connection.close()


@app.post("/generate-data/")
async def generate_weather_data(
    year: int = Query(..., ge=2000, le=2100, description="年份"),
    month: int = Query(..., ge=1, le=12, description="月份"),
    seed: Optional[int] = Query(None, description="随机种子(可选)")
):
    """生成并插入指定月份的天气数据"""
    try:
        rng = random.Random(seed) if seed else random.Random()
        weather_data = generate_monthly_weather_data(year, month, rng)
        inserted_count = insert_weather_data(weather_data)
        return {
            "status": "success",
            "message": f"成功生成{inserted_count}条天气数据",
            "year": year,
            "month": month
        }
    except ValueError as e:
        raise HTTPException(status_code=400, detail=str(e))
    except Exception as e:
        raise HTTPException(status_code=500, detail=f"数据库操作失败: {str(e)}")

@app.get("/weather-data/")
async def get_weather(
    year: int = Query(..., ge=2000, le=2100, description="年份"),
    month: int = Query(..., ge=1, le=12, description="月份")
):
    """获取指定月份的天气数据"""
    try:
        data = get_weather_data(year, month)
        return {
            "status": "success",
            "count": len(data),
            "year": year,
            "month": month,
            "data": data
        }
    except Exception as e:
        raise HTTPException(status_code=500, detail=f"数据查询失败: {str(e)}")

if __name__ == "__main__":
    import uvicorn
    uvicorn.run(app, host="0.0.0.0", port=8000)
step4:vue
C:\Users\wangrusheng\PycharmProjects\untitled3\src\views\Lottery.vue
<template>
  <div>
    <div class="controls">
      <input v-model.number="year" type="number" placeholder="年份">
      <input v-model.number="month" type="number" placeholder="月份" min="1" max="12">
      <button @click="fetchData">查询</button>
      <button @click="generateData">生成数据</button>
    </div>

    <div class="charts-container">
      <div class="chart-box">
        <h3>每日温度柱状图</h3>
        <div ref="barChart" class="chart"></div>
      </div>

      <div class="chart-box">
        <h3>温度趋势折线图</h3>
        <div ref="lineChart" class="chart"></div>
      </div>

      <div class="chart-box">
        <h3>天气状况分布饼图</h3>
        <div ref="pieChart" class="chart"></div>
      </div>
    </div>
  </div>
</template>

<script>
import * as d3 from 'd3';
import axios from 'axios';

export default {
  data() {
    return {
      weatherData: [],
      year: null,
      month: null
    };
  },
  methods: {
    async fetchData() {
      if (!this.validateInput()) return;

      try {
        const response = await axios.get('http://localhost:8000/weather-data/', {
          params: { year: this.year, month: this.month }
        });
        this.weatherData = response.data.data;
        this.redrawCharts();
      } catch (error) {
        this.handleError(error, '查询');
      }
    },

    async generateData() {
      if (!this.validateInput()) return;

      try {
        const response = await axios.post('http://localhost:8000/generate-data/', null, {
          params: { year: this.year, month: this.month, seed: 42 },
          headers: { 'Content-Type': 'application/json' }
        });
        alert(`生成成功:${response.data.message}`);
        await this.fetchData();
      } catch (error) {
        this.handleError(error, '生成');
      }
    },

    validateInput() {
      if (!this.year || !this.month) {
        alert('请填写年份和月份');
        return false;
      }
      if (this.month < 1 || this.month > 12) {
        alert('月份必须为1-12');
        return false;
      }
      return true;
    },

    handleError(error, operation) {
      console.error(`${operation}失败:`, error);
      alert(`${operation}失败,请检查控制台`);
    },

    redrawCharts() {
      this.clearCharts();
      this.drawBarChart();
      this.drawLineChart();
      this.drawPieChart();
    },

    clearCharts() {
      [this.$refs.barChart, this.$refs.lineChart, this.$refs.pieChart]
        .forEach(ref => ref.innerHTML = '');
    },

    // 各图表绘制方法(保持原有实现,开头添加清除逻辑)
    // 绘制柱状图
    drawBarChart() {
      const margin = { top: 30, right: 30, bottom: 50, left: 60 };
      const width = 800 - margin.left - margin.right;
      const height = 400 - margin.top - margin.bottom;

      const svg = d3.select(this.$refs.barChart)
        .append('svg')
        .attr('width', width + margin.left + margin.right)
        .attr('height', height + margin.top + margin.bottom)
        .append('g')
        .attr('transform', `translate(${margin.left},${margin.top})`);

      // 创建比例尺
      const x = d3.scaleBand()
        .domain(this.weatherData.map(d => d.record_date))
        .range([0, width])
        .padding(0.2);

      const y = d3.scaleLinear()
        .domain([0, d3.max(this.weatherData, d => d.temperature)])
        .range([height, 0]);

      // 添加柱状
      svg.selectAll("rect")
        .data(this.weatherData)
        .join("rect")
          .attr("x", d => x(d.record_date))
          .attr("y", d => y(d.temperature))
          .attr("width", x.bandwidth())
          .attr("height", d => height - y(d.temperature))
          .attr("fill", "#4CAF50");

      // 添加坐标轴
      svg.append("g")
        .attr("transform", `translate(0,${height})`)
        .call(d3.axisBottom(x).tickValues(x.domain().filter((d,i) => !(i%5))));

      svg.append("g")
        .call(d3.axisLeft(y));

      // 添加标签
      svg.append("text")
        .attr("transform", `translate(${width/2}, ${height + 40})`)
        .style("text-anchor", "middle")
        .text("日期");

      svg.append("text")
        .attr("transform", "rotate(-90)")
        .attr("y", 0 - margin.left)
        .attr("x",0 - (height / 2))
        .attr("dy", "1em")
        .style("text-anchor", "middle")
        .text("温度(℃)");
    },


    // 绘制折线图
    drawLineChart() {
      const margin = { top: 30, right: 30, bottom: 50, left: 60 };
      const width = 800 - margin.left - margin.right;
      const height = 400 - margin.top - margin.bottom;

      const svg = d3.select(this.$refs.lineChart)
        .append('svg')
        .attr('width', width + margin.left + margin.right)
        .attr('height', height + margin.top + margin.bottom)
        .append('g')
        .attr('transform', `translate(${margin.left},${margin.top})`);

      // 创建比例尺
      const x = d3.scaleBand()
        .domain(this.weatherData.map(d => d.record_date))
        .range([0, width]);

      const y = d3.scaleLinear()
        .domain([d3.min(this.weatherData, d => d.temperature) - 2, d3.max(this.weatherData, d => d.temperature) + 2])
        .range([height, 0]);

      // 创建折线生成器
      const line = d3.line()
        .x(d => x(d.record_date) + x.bandwidth()/2)
        .y(d => y(d.temperature));

      // 绘制折线
      svg.append("path")
        .datum(this.weatherData)
        .attr("fill", "none")
        .attr("stroke", "#2196F3")
        .attr("stroke-width", 2)
        .attr("d", line);

      // 添加坐标轴
      svg.append("g")
        .attr("transform", `translate(0,${height})`)
        .call(d3.axisBottom(x).tickValues(x.domain().filter((d,i) => !(i%5))));

      svg.append("g")
        .call(d3.axisLeft(y));
    },

    // 绘制饼图
    drawPieChart() {
      const width = 400;
      const height = 400;
      const radius = Math.min(width, height) / 2;

      const svg = d3.select(this.$refs.pieChart)
        .append('svg')
        .attr('width', width)
        .attr('height', height)
        .append('g')
        .attr('transform', `translate(${width/2},${height/2})`);

      // 统计天气状况
      const data = Array.from(
        d3.rollup(this.weatherData,
          v => v.length,
          d => d.weather_condition
        ),
        ([name, value]) => ({name, value})
      );

      // 创建颜色比例尺
      const color = d3.scaleOrdinal()
        .domain(data.map(d => d.name))
        .range(d3.schemeCategory10);

      // 饼图生成器
      const pie = d3.pie()
        .value(d => d.value);

      // 弧形生成器
      const arc = d3.arc()
        .innerRadius(0)
        .outerRadius(radius);

      // 绘制扇形
      const arcs = svg.selectAll("arc")
        .data(pie(data))
        .enter()
        .append("g")
        .attr("class", "arc");

      arcs.append("path")
        .attr("d", arc)
        .attr("fill", d => color(d.data.name))
        .attr("stroke", "white")
        .style("stroke-width", "2px");

      // 添加标签
      arcs.append("text")
        .attr("transform", d => `translate(${arc.centroid(d)})`)
        .attr("text-anchor", "middle")
        .text(d => d.data.name);
    }


  }
};
</script>

<style>
.controls {
  padding: 1rem;
  display: flex;
  gap: 1rem;
  align-items: center;
}

.controls input {
  padding: 0.5rem;
  border: 1px solid #ddd;
  border-radius: 4px;
  width: 120px;
}

.controls button {
  padding: 0.5rem 1rem;
  background: #2196F3;
  color: white;
  border: none;
  border-radius: 4px;
  cursor: pointer;
}

.controls button:hover {
  background: #1976D2;
}

.charts-container {
  display: flex;
  flex-direction: column;
  gap: 2rem;
  padding: 2rem;
}

.chart-box {
  background: white;
  padding: 1rem;
  border-radius: 8px;
  box-shadow: 0 2px 4px rgba(0,0,0,0.1);
  width: 100%;
}

.chart-box h3 {
  margin: 0 0 1rem;
  color: #333;
}

.chart {
  width: 100%;
  height: 400px;
}
</style>
end
//我是分割线
step101: old vue
下面的代码修改:

1.年份 月份 改为可选,
2.新增两个按钮,查询和添加
3.查询和添加,需要做网络请求
4.三个图表 需要垂直排列

1. 生成天气数据(POST请求):


URL: http://localhost:8000/generate-data/?year=2024&month=3&seed=42
方法: POST
Headers:
  Content-Type: application/json
成功响应示例:
{
    "status": "success",
    "message": "成功生成31条天气数据",
    "year": 2024,
    "month": 3
}

<template>
  <div class="charts-container">
    <div class="chart-box">
      <h3>每日温度柱状图</h3>
      <div ref="barChart" class="chart"></div>
    </div>

    <div class="chart-box">
      <h3>温度趋势折线图</h3>
      <div ref="lineChart" class="chart"></div>
    </div>

    <div class="chart-box">
      <h3>天气状况分布饼图</h3>
      <div ref="pieChart" class="chart"></div>
    </div>
  </div>
</template>

<script>
import * as d3 from 'd3';
import axios from 'axios';

export default {
  data() {
    return {
      weatherData: []
    };
  },
  async mounted() {
    try {
      const response = await axios.get('http://localhost:8000/weather-data/?year=2024&month=4');
      this.weatherData = response.data.data;
      this.drawBarChart();
      this.drawLineChart();
      this.drawPieChart();
    } catch (error) {
      console.error('数据获取失败:', error);
    }
  },
  methods: {
    // 绘制柱状图
    drawBarChart() {
      const margin = { top: 30, right: 30, bottom: 50, left: 60 };
      const width = 800 - margin.left - margin.right;
      const height = 400 - margin.top - margin.bottom;

      const svg = d3.select(this.$refs.barChart)
        .append('svg')
        .attr('width', width + margin.left + margin.right)
        .attr('height', height + margin.top + margin.bottom)
        .append('g')
        .attr('transform', `translate(${margin.left},${margin.top})`);

      // 创建比例尺
      const x = d3.scaleBand()
        .domain(this.weatherData.map(d => d.record_date))
        .range([0, width])
        .padding(0.2);

      const y = d3.scaleLinear()
        .domain([0, d3.max(this.weatherData, d => d.temperature)])
        .range([height, 0]);

      // 添加柱状
      svg.selectAll("rect")
        .data(this.weatherData)
        .join("rect")
          .attr("x", d => x(d.record_date))
          .attr("y", d => y(d.temperature))
          .attr("width", x.bandwidth())
          .attr("height", d => height - y(d.temperature))
          .attr("fill", "#4CAF50");

      // 添加坐标轴
      svg.append("g")
        .attr("transform", `translate(0,${height})`)
        .call(d3.axisBottom(x).tickValues(x.domain().filter((d,i) => !(i%5))));

      svg.append("g")
        .call(d3.axisLeft(y));

      // 添加标签
      svg.append("text")
        .attr("transform", `translate(${width/2}, ${height + 40})`)
        .style("text-anchor", "middle")
        .text("日期");

      svg.append("text")
        .attr("transform", "rotate(-90)")
        .attr("y", 0 - margin.left)
        .attr("x",0 - (height / 2))
        .attr("dy", "1em")
        .style("text-anchor", "middle")
        .text("温度(℃)");
    },

    // 绘制折线图
    drawLineChart() {
      const margin = { top: 30, right: 30, bottom: 50, left: 60 };
      const width = 800 - margin.left - margin.right;
      const height = 400 - margin.top - margin.bottom;

      const svg = d3.select(this.$refs.lineChart)
        .append('svg')
        .attr('width', width + margin.left + margin.right)
        .attr('height', height + margin.top + margin.bottom)
        .append('g')
        .attr('transform', `translate(${margin.left},${margin.top})`);

      // 创建比例尺
      const x = d3.scaleBand()
        .domain(this.weatherData.map(d => d.record_date))
        .range([0, width]);

      const y = d3.scaleLinear()
        .domain([d3.min(this.weatherData, d => d.temperature) - 2, d3.max(this.weatherData, d => d.temperature) + 2])
        .range([height, 0]);

      // 创建折线生成器
      const line = d3.line()
        .x(d => x(d.record_date) + x.bandwidth()/2)
        .y(d => y(d.temperature));

      // 绘制折线
      svg.append("path")
        .datum(this.weatherData)
        .attr("fill", "none")
        .attr("stroke", "#2196F3")
        .attr("stroke-width", 2)
        .attr("d", line);

      // 添加坐标轴
      svg.append("g")
        .attr("transform", `translate(0,${height})`)
        .call(d3.axisBottom(x).tickValues(x.domain().filter((d,i) => !(i%5))));

      svg.append("g")
        .call(d3.axisLeft(y));
    },

    // 绘制饼图
    drawPieChart() {
      const width = 400;
      const height = 400;
      const radius = Math.min(width, height) / 2;

      const svg = d3.select(this.$refs.pieChart)
        .append('svg')
        .attr('width', width)
        .attr('height', height)
        .append('g')
        .attr('transform', `translate(${width/2},${height/2})`);

      // 统计天气状况
      const data = Array.from(
        d3.rollup(this.weatherData,
          v => v.length,
          d => d.weather_condition
        ),
        ([name, value]) => ({name, value})
      );

      // 创建颜色比例尺
      const color = d3.scaleOrdinal()
        .domain(data.map(d => d.name))
        .range(d3.schemeCategory10);

      // 饼图生成器
      const pie = d3.pie()
        .value(d => d.value);

      // 弧形生成器
      const arc = d3.arc()
        .innerRadius(0)
        .outerRadius(radius);

      // 绘制扇形
      const arcs = svg.selectAll("arc")
        .data(pie(data))
        .enter()
        .append("g")
        .attr("class", "arc");

      arcs.append("path")
        .attr("d", arc)
        .attr("fill", d => color(d.data.name))
        .attr("stroke", "white")
        .style("stroke-width", "2px");

      // 添加标签
      arcs.append("text")
        .attr("transform", d => `translate(${arc.centroid(d)})`)
        .attr("text-anchor", "middle")
        .text(d => d.data.name);
    }
  }
};
</script>

<style>
.charts-container {
  display: grid;
  grid-template-columns: repeat(auto-fit, minmax(400px, 1fr));
  gap: 2rem;
  padding: 2rem;
}

.chart-box {
  background: white;
  padding: 1rem;
  border-radius: 8px;
  box-shadow: 0 2px 4px rgba(0,0,0,0.1);
}

.chart-box h3 {
  margin: 0 0 1rem;
  color: #333;
}

.chart {
  width: 100%;
  height: 400px;
}
</style>
step102:c++ 模拟数据
C:\Users\wangrusheng\source\repos\CMakeProject1\CMakeProject1\CMakeProject1.cpp
#include <iostream>
#include <random>
#include <vector>
#include <string>
#include <iomanip>
#include <cmath>

struct WeatherData {
    int day;
    double temperature;
    int humidity;
    double precipitation;
    double wind_speed;
    std::string condition;
};

// 生成温度(可指定范围)
double generate_temperature(std::mt19937& gen, double min_temp = 10.0, double max_temp = 20.0) {
    std::uniform_real_distribution<double> dist(min_temp, max_temp);
    return std::round(dist(gen) * 10) / 10.0; // 保留1位小数
}

// 生成湿度(正态分布)
int generate_humidity(std::mt19937& gen) {
    std::normal_distribution<double> dist(60.0, 15.0);
    double humidity = dist(gen);
    humidity = std::clamp(humidity, 0.0, 100.0);
    return static_cast<int>(std::round(humidity));
}

// 生成降水量(20%概率下雨)
double generate_precipitation(std::mt19937& gen) {
    std::bernoulli_distribution rain_dist(0.2);
    if (rain_dist(gen)) {
        std::exponential_distribution<double> amount_dist(1.0 / 5.0); // 平均5mm
        double amount = amount_dist(gen);
        amount = std::clamp(amount, 0.1, 30.0);
        return std::round(amount * 10) / 10.0; // 保留1位小数
    }
    return 0.0;
}

// 生成风速(伽马分布)
double generate_wind_speed(std::mt19937& gen) {
    std::gamma_distribution<double> dist(2.0, 2.0);
    double speed = dist(gen);
    speed = std::clamp(speed, 0.0, 20.0);
    return std::round(speed * 10) / 10.0; // 保留1位小数
}

// 生成天气状况
std::string get_condition(double temp, double precip, int humidity) {
    if (precip > 0) {
        return (temp < 3.0) ? "Snow" : "Rain";
    }

    if (humidity >= 70) return "Cloudy";
    if (humidity <= 30) return "Sunny";

    // 随机选择部分多云或阴天
    static std::vector<std::string> options = { "Partly Cloudy", "Mostly Cloudy" };
    std::uniform_int_distribution<int> dist(0, 1);
    std::mt19937 temp_gen(std::random_device{}());
    return options[dist(temp_gen)];
}

// 生成完整月份数据
std::vector<WeatherData> generate_april_data(std::mt19937& gen) {
    std::vector<WeatherData> data;
    for (int day = 1; day <= 30; ++day) {
        WeatherData wd;
        wd.day = day;
        wd.temperature = generate_temperature(gen);
        wd.humidity = generate_humidity(gen);
        wd.precipitation = generate_precipitation(gen);
        wd.wind_speed = generate_wind_speed(gen);
        wd.condition = get_condition(wd.temperature, wd.precipitation, wd.humidity);
        data.push_back(wd);
    }
    return data;
}

int main() {
    // 初始化随机数生成器
    std::random_device rd;
    std::mt19937 gen(rd());

    // 生成数据
    auto weather_data = generate_april_data(gen);

    // 输出CSV格式
    std::cout << "Day,Temperature,Humidity,Precipitation,Wind Speed,Condition\n";
    for (const auto& wd : weather_data) {
        std::cout << wd.day << ","
            << std::fixed << std::setprecision(1) << wd.temperature << "°C,"
            << wd.humidity << "%,"
            << wd.precipitation << "mm,"
            << wd.wind_speed << "m/s,"
            << wd.condition << "\n";
    }

    return 0;
}
到此这篇关于vue+d3js+fastapi实现天气柱状图折线图饼图的示例的文章就介绍到这了,更多相关vue+d3js+fastapi柱状图折线图饼图内容请搜索脚本之家以前的文章或继续浏览下面的相关文章希望大家以后多多支持脚本之家!
来源链接:https://www.jb51.net/javascript/3393976ap.htm
© 版权声明
本站所有资源来自于网络,仅供学习与参考,请勿用于商业用途,否则产生的一切后果将由您(转载者)自己承担!
如有侵犯您的版权,请及时联系3500663466#qq.com(#换@),我们将第一时间删除本站数据。
如有侵犯您的版权,请及时联系3500663466#qq.com(#换@),我们将第一时间删除本站数据。
THE END


暂无评论内容