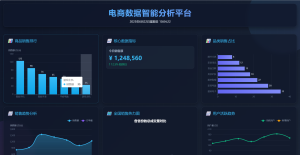


数据可视化大屏
作为大数据的学生,每次想实现前端数据可视化大屏就头疼,不会前端就很烦,所以这次特定不断调教AI,再加上自己不断的改改改,终于花了一个下午改成了一个还过得去的可视化大屏,所以直接把源码分享在这里了,但是要自己导入echarts组件
index.html页面
<!DOCTYPE html>
<html lang="zh-CN">
<head>
    <meta charset="UTF-8">
    <meta name="viewport" content="width=device-width, initial-scale=1.0">
    <title>电商数据可视化大屏</title>
    <script src="./StyleUtils/js/utils/echarts.min.js"></script>
    <script src="./StyleUtils/map/china.js"></script>
    <script src="./StyleUtils/js/utils/jQuery.js"></script>
    <link rel="stylesheet" href="style.css">
</head>
<body>
<div class="decoration decoration-1"></div>
<div class="decoration decoration-2"></div>
<div class="grid-line"></div>

<div class="dashboard">
    <div class="header">
        <h1>电商数据智能分析平台</h1>
        <div id="timeDisplay"></div>
    </div>

    <!-- 第二行 -->
    <div class="card">
        <div class="card-title">
            <i></i> 商品销售排行
        </div>
        <div class="chart-container" id="barChart1"></div>
    </div>

    <div class="card">
        <div class="card-title">
            <i></i> 核心数据指标
        </div>
        <div class="stats-container">
            <div class="stat-card">
                <h3>今日销售额</h3>
                <div class="stat-value">¥ 1,248,560</div>
                <div class="stat-trend trend-up">↑ 12.5% 较昨日</div>
            </div>
            <!--      <div class="stat-card">-->
            <!--        <h3>订单完成量</h3>-->
            <!--        <div class="stat-value">24,856</div>-->
            <!--        <div class="stat-trend trend-up">↑ 8.3% 较昨日</div>-->
            <!--      </div>-->
            <!--      <div class="stat-card">-->
            <!--        <h3>用户访问量</h3>-->
            <!--        <div class="stat-value">186,423</div>-->
            <!--        <div class="stat-trend trend-down">↓ 3.2% 较昨日</div>-->
            <!--      </div>-->
            <!--      <div class="stat-card">-->
            <!--        <h3>转化率</h3>-->
            <!--        <div class="stat-value">13.4%</div>-->
            <!--        <div class="stat-trend trend-up">↑ 1.7% 较昨日</div>-->
            <!--      </div>-->
        </div>
    </div>

    <div class="card">
        <div class="card-title">
            <i></i> 品类销售占比
        </div>
        <div class="chart-container" id="barChart2"></div>
    </div>

    <!-- 第三行 -->
    <div class="card">
        <div class="card-title">
            <i></i> 销售趋势分析
        </div>
        <div class="chart-container" id="lineChart1"></div>
    </div>

    <div class="card map-container">
        <div class="card-title">
            <i>️</i> 全国销售热力图
        </div>
        <div class="chart-container" id="mapChart"></div>
    </div>

    <div class="card">
        <div class="card-title">
            <i></i> 用户活跃趋势
        </div>
        <div class="chart-container" id="lineChart2"></div>
    </div>

    <!-- 第四行 -->
    <div class="card">
        <div class="card-title">
            <i></i> 用户年龄分布
        </div>
        <div class="chart-container" id="pieChart1"></div>
    </div>

    <div class="card">
        <div class="card-title">
            <i></i> 支付方式占比
        </div>
        <div class="chart-container" id="pieChart2"></div>
    </div>

    <div class="footer">
        <p>数据更新时间: 2023年11月15日 14:28:35 | © 2023 电商数据平台 版权所有</p>
    </div>
</div>

<script src="style.js"></script>
</body>
</html>
index.css
* {
    margin: 0;
    padding: 0;
    box-sizing: border-box;
    font-family: 'Microsoft YaHei', sans-serif;
}

body {
    background: linear-gradient(135deg, #0f172a, #1e293b);
    color: #e2e8f0;
    min-height: 100vh;
    padding: 20px;
    overflow-x: hidden;
}

.dashboard {
    display: grid;
    grid-template-columns: repeat(3, 1fr);
    grid-template-rows: auto;
    gap: 20px;
    max-width: 1920px;
    margin: 0 auto;
}

.header {
    grid-column: 1 / span 3;
    background: rgba(15, 23, 42, 0.8);
    border-radius: 16px;
    padding: 20px;
    text-align: center;
    border: 1px solid rgba(100, 116, 139, 0.3);
    box-shadow: 0 10px 25px rgba(0, 0, 0, 0.4);
    backdrop-filter: blur(10px);
    margin-bottom: 20px;
}

.header h1 {
    font-size: 2.8rem;
    margin-bottom: 10px;
    background: linear-gradient(90deg, #38bdf8, #818cf8);
    -webkit-background-clip: text;
    background-clip: text;
    color: transparent;
    letter-spacing: 2px;
}

.header p {
    font-size: 1.2rem;
    color: #94a3b8;
    max-width: 800px;
    margin: 0 auto;
}

.card {
    background: rgba(15, 23, 42, 0.7);
    border-radius: 16px;
    border: 1px solid rgba(100, 116, 139, 0.3);
    padding: 20px;
    box-shadow: 0 8px 20px rgba(0, 0, 0, 0.3);
    backdrop-filter: blur(10px);
    transition: transform 0.3s ease, box-shadow 0.3s ease;
    height: 100%;
    display: flex;
    flex-direction: column;
}

.card:hover {
    transform: translateY(-5px);
    box-shadow: 0 12px 25px rgba(0, 0, 0, 0.5);
    border-color: rgba(56, 189, 248, 0.5);
}

.card-title {
    font-size: 1.3rem;
    margin-bottom: 15px;
    color: #38bdf8;
    display: flex;
    align-items: center;
    gap: 10px;
}

.card-title i {
    font-size: 1.5rem;
}

.chart-container {
    flex: 1;
    min-height: 300px;
}

.stats-container {
    display: grid;
    grid-template-columns: 1fr;
    gap: 15px;
}

.stat-card {
    background: rgba(30, 41, 59, 0.6);
    border-radius: 12px;
    padding: 15px;
    display: flex;
    flex-direction: column;
    justify-content: center;
    border: 1px solid rgba(100, 116, 139, 0.2);
}

.stat-card h3 {
    font-size: 1rem;
    color: #94a3b8;
    margin-bottom: 8px;
}

.stat-value {
    font-size: 2rem;
    font-weight: bold;
    color: #38bdf8;
}

.stat-trend {
    display: flex;
    align-items: center;
    font-size: 0.9rem;
    margin-top: 5px;
}

.trend-up {
    color: #10b981;
}

.trend-down {
    color: #ef4444;
}

.map-container {
    grid-row: 3 / span 2;
    grid-column: 2;
}

.footer {
    grid-column: 1 / span 3;
    text-align: center;
    padding: 20px;
    font-size: 0.9rem;
    color: #64748b;
    margin-top: 20px;
}

/* 响应式调整 */
@media (max-width: 1200px) {
    .dashboard {
        grid-template-columns: 1fr 1fr;
    }

    .header, .footer {
        grid-column: 1 / span 2;
    }

    .map-container {
        grid-row: auto;
        grid-column: 1 / span 2;
    }
}

@media (max-width: 768px) {
    .dashboard {
        grid-template-columns: 1fr;
    }

    .header, .footer {
        grid-column: 1;
    }

    .map-container {
        grid-column: 1;
    }
}

/* 装饰元素 */
.decoration {
    position: absolute;
    z-index: -1;
    opacity: 0.1;
}

.decoration-1 {
    width: 400px;
    height: 400px;
    border-radius: 50%;
    background: linear-gradient(135deg, #38bdf8, #818cf8);
    top: -100px;
    right: -100px;
}

.decoration-2 {
    width: 300px;
    height: 300px;
    border-radius: 50%;
    background: linear-gradient(135deg, #8b5cf6, #ec4899);
    bottom: -100px;
    left: -100px;
}

.grid-line {
    position: absolute;
    top: 0;
    left: 0;
    width: 100%;
    height: 100%;
    background:
            linear-gradient(to right, rgba(100, 116, 139, 0.05) 1px, transparent 1px),
            linear-gradient(to bottom, rgba(100, 116, 139, 0.05) 1px, transparent 1px);
    background-size: 40px 40px;
    z-index: -1;
}
index.js(我自己加了一个后端获取的通用方法,到时根据自己需求稍微改改代码就可以了,数据都是静态数据,后续有时间我就更新怎么从后端获取数据,然后进行数据显示)
// 通用数据获取
async function fetchData(url, params = {}) {
try {
const response = await fetch(url, {
method: 'GET',
headers: {
'Content-Type': 'application/json',
},
body: JSON.stringify(params),
})
if (!response.ok) {
throw new Error(`HTTP error! status: ${response.status}`);
}
return await response.json();
} catch (error) {
console.error(error);
return null;
}
}
// 初始化所有图表
document.addEventListener('DOMContentLoaded', function() {
// 更新时间显示
function updateTime() {
const now = new Date();
const timeDisplay = document.getElementById('timeDisplay');
const options = {
year: 'numeric',
month: 'long',
day: 'numeric',
weekday: 'long',
hour: '2-digit',
minute: '2-digit',
second: '2-digit',
hour12: false
};
timeDisplay.textContent = now.toLocaleDateString('zh-CN', options);
}
// 初始化时间并设置定时器
updateTime();
setInterval(updateTime, 1000);
function initOption() {
bar1()
bar2()
line1()
line2()
pie1()
pie2()
map()
}
// 商品销售排行
function bar1() {
const barChart1 = echarts.init(document.getElementById('barChart1'));
const option = {
tooltip: {
trigger: 'axis',
axisPointer: {
type: 'shadow'
}
},
grid: {
left: '3%',
right: '4%',
bottom: '3%',
top: '15%',
containLabel: true
},
xAxis: {
type: 'category',
data: ['智能手机', '笔记本电脑', '智能手表', '蓝牙耳机', '平板电脑', '相机', '游戏主机'],
axisLine: {
lineStyle: {
color: '#64748b'
}
}
},
yAxis: {
type: 'value',
name: '销售额 (万元)',
nameTextStyle: {
color: '#94a3b8'
},
axisLine: {
lineStyle: {
color: '#64748b'
}
},
splitLine: {
lineStyle: {
color: 'rgba(100, 116, 139, 0.2)'
}
}
},
series: [{
name: '销售额',
type: 'bar',
data: [125, 98, 76, 65, 58, 42, 35],
itemStyle: {
color: new echarts.graphic.LinearGradient(0, 0, 0, 1, [
{ offset: 0, color: '#38bdf8' },
{ offset: 1, color: '#0ea5e9' }
])
},
label: {
show: true,
position: 'top',
color: '#e2e8f0'
}
}]
};
barChart1.setOption(option);
}
// 品类销售占比
function bar2() {
const barChart2 = echarts.init(document.getElementById('barChart2'));
const option = {
tooltip: {
trigger: 'axis',
axisPointer: {
type: 'shadow'
}
},
grid: {
left: '3%',
right: '4%',
bottom: '3%',
top: '15%',
containLabel: true
},
xAxis: {
type: 'value',
axisLine: {
lineStyle: {
color: '#64748b'
}
},
splitLine: {
lineStyle: {
color: 'rgba(100, 116, 139, 0.2)'
}
}
},
yAxis: {
type: 'category',
data: ['数码电子', '家用电器', '服装鞋帽', '美妆护肤', '食品生鲜', '家居用品', '图书文具'],
axisLine: {
lineStyle: {
color: '#64748b'
}
}
},
series: [{
name: '占比',
type: 'bar',
data: [35, 28, 22, 18, 15, 12, 8],
itemStyle: {
color: new echarts.graphic.LinearGradient(1, 0, 0, 0, [
{ offset: 0, color: '#818cf8' },
{ offset: 1, color: '#6366f1' }
])
},
label: {
show: true,
position: 'right',
color: '#e2e8f0'
}
}]
}
barChart2.setOption(option);
}
// 销售趋势分析
function line1() {
const lineChart1 = echarts.init(document.getElementById('lineChart1'));
const option = {
tooltip: {
trigger: 'axis'
},
legend: {
data: ['销售额', '订单量'],
textStyle: {
color: '#94a3b8'
},
right: 10,
top: 0
},
grid: {
left: '3%',
right: '4%',
bottom: '3%',
top: '20%',
containLabel: true
},
xAxis: {
type: 'category',
boundaryGap: false,
data: ['11/09', '11/10', '11/11', '11/12', '11/13', '11/14', '11/15'],
axisLine: {
lineStyle: {
color: '#64748b'
}
}
},
yAxis: {
type: 'value',
name: '销售额 (万元)',
nameTextStyle: {
color: '#94a3b8'
},
axisLine: {
lineStyle: {
color: '#64748b'
}
},
splitLine: {
lineStyle: {
color: 'rgba(100, 116, 139, 0.2)'
}
}
},
series: [
{
name: '销售额',
type: 'line',
data: [820, 932, 1560, 1434, 1290, 1030, 1248],
smooth: true,
lineStyle: {
width: 3,
color: '#38bdf8'
},
symbol: 'circle',
symbolSize: 8,
itemStyle: {
color: '#38bdf8'
},
areaStyle: {
color: new echarts.graphic.LinearGradient(0, 0, 0, 1, [
{ offset: 0, color: 'rgba(56, 189, 248, 0.5)' },
{ offset: 1, color: 'rgba(56, 189, 248, 0.1)' }
])
}
},
{
name: '订单量',
type: 'line',
yAxisIndex: 0,
data: [18.2, 19.5, 32.4, 28.6, 25.3, 20.8, 24.8],
smooth: true,
lineStyle: {
width: 3,
color: '#8b5cf6'
},
symbol: 'circle',
symbolSize: 8,
itemStyle: {
color: '#8b5cf6'
}
}
]
}
lineChart1.setOption(option);
}
// 用户活跃趋势
function line2() {
const lineChart2 = echarts.init(document.getElementById('lineChart2'));
const option = {
tooltip: {
trigger: 'axis'
},
legend: {
data: ['活跃用户', '新增用户'],
textStyle: {
color: '#94a3b8'
},
right: 10,
top: 0
},
grid: {
left: '3%',
right: '4%',
bottom: '3%',
top: '20%',
containLabel: true
},
xAxis: {
type: 'category',
boundaryGap: false,
data: ['周一', '周二', '周三', '周四', '周五', '周六', '周日'],
axisLine: {
lineStyle: {
color: '#64748b'
}
}
},
yAxis: {
type: 'value',
name: '用户量 (万)',
nameTextStyle: {
color: '#94a3b8'
},
axisLine: {
lineStyle: {
color: '#64748b'
}
},
splitLine: {
lineStyle: {
color: 'rgba(100, 116, 139, 0.2)'
}
}
},
series: [
{
name: '活跃用户',
type: 'line',
data: [132, 145, 158, 142, 168, 185, 162],
smooth: true,
lineStyle: {
width: 3,
color: '#10b981'
},
symbol: 'circle',
symbolSize: 8,
itemStyle: {
color: '#10b981'
}
},
{
name: '新增用户',
type: 'line',
data: [28, 32, 36, 31, 35, 42, 38],
smooth: true,
lineStyle: {
width: 3,
color: '#f59e0b'
},
symbol: 'circle',
symbolSize: 8,
itemStyle: {
color: '#f59e0b'
}
}
]
}
lineChart2.setOption(option);
}
// 用户年龄分布
function pie1() {
const pieChart1 = echarts.init(document.getElementById('pieChart1'));
const option = {
tooltip: {
trigger: 'item',
formatter: '{a} <br/>{b}: {c} ({d}%)'
},
legend: {
orient: 'vertical',
right: 10,
top: 'center',
textStyle: {
color: '#94a3b8'
}
},
series: [
{
name: '年龄分布',
type: 'pie',
radius: ['40%', '70%'],
center: ['40%', '50%'],
avoidLabelOverlap: false,
itemStyle: {
borderRadius: 10,
borderColor: '#0f172a',
borderWidth: 2
},
label: {
show: false,
position: 'center'
},
emphasis: {
label: {
show: true,
fontSize: '18',
fontWeight: 'bold'
}
},
labelLine: {
show: false
},
data: [
{ value: 28, name: '18岁以下', itemStyle: { color: '#38bdf8' } },
{ value: 145, name: '18-25岁', itemStyle: { color: '#818cf8' } },
{ value: 235, name: '26-35岁', itemStyle: { color: '#8b5cf6' } },
{ value: 187, name: '36-45岁', itemStyle: { color: '#ec4899' } },
{ value: 95, name: '46-60岁', itemStyle: { color: '#f59e0b' } },
{ value: 42, name: '60岁以上', itemStyle: { color: '#10b981' } }
]
}
]
}
pieChart1.setOption(option);
}
// 支付方式占比
function pie2() {
const pieChart2 = echarts.init(document.getElementById('pieChart2'));
const option = {
tooltip: {
trigger: 'item',
formatter: '{a} <br/>{b}: {c} ({d}%)'
},
series: [
{
name: '支付方式',
type: 'pie',
radius: '70%',
center: ['50%', '50%'],
roseType: 'radius',
itemStyle: {
borderRadius: 5,
borderColor: '#0f172a',
borderWidth: 2
},
label: {
color: '#e2e8f0'
},
data: [
{ value: 45, name: '支付宝', itemStyle: { color: '#1677ff' } },
{ value: 30, name: '微信支付', itemStyle: { color: '#07c160' } },
{ value: 15, name: '银行卡', itemStyle: { color: '#0ea5e9' } },
{ value: 8, name: '云闪付', itemStyle: { color: '#eb2f96' } },
{ value: 2, name: '其他方式', itemStyle: { color: '#f59e0b' } }
]
}
]
}
pieChart2.setOption(option);
}
// 随机数
function randomData() {
return Math.round(Math.random() * 500);
}
// 全国销售热力图
function map() {
const mapChart = echarts.init(document.getElementById('mapChart'));
const mydata = [
{name: '北京',value: randomData() },{name: '天津',value: randomData() },
{name: '上海',value: randomData() },{name: '重庆',value: randomData() },
{name: '河北',value: randomData() },{name: '河南',value: randomData() },
{name: '云南',value: randomData() },{name: '辽宁',value: randomData() },
{name: '黑龙江',value: randomData() },{name: '湖南',value: randomData()},
{name: '安徽',value: randomData() },{name: '山东',value: randomData() },
{name: '新疆',value: randomData() },{name: '江苏',value: randomData() },
{name: '浙江',value: randomData() },{name: '江西',value: randomData() },
{name: '湖北',value: randomData() },{name: '广西',value: randomData() },
{name: '甘肃',value: randomData() },{name: '山西',value: randomData() },
{name: '内蒙古',value: randomData() },{name: '陕西',value: randomData()},
{name: '吉林',value: randomData() },{name: '福建',value: randomData() },
{name: '贵州',value: randomData() },{name: '广东',value: randomData() },
{name: '青海',value: randomData() },{name: '西藏',value: randomData() },
{name: '四川',value: randomData() },{name: '宁夏',value: randomData() },
{name: '海南',value: randomData() },{name: '台湾',value: randomData() },
{name: '香港',value: randomData() },{name: '澳门',value: randomData() }
];
const option = {
//backgroundColor: '#FFFFFF',
// 标题
title: {
text: '各省份的总成交量对比',
textStyle:{color:'#fff'},
//subtext: '纯属虚构',
x:'center',
show: true
},
// 提示框
tooltip : {
trigger: 'item'
},
visualMap: {
show : true,
x: 'left',
y: 'bottom',
//layoutCenter:['30%','30%'],
splitList: [
{start: 500, end:600},{start: 400, end: 500},
{start: 300, end: 400},{start: 200, end: 300},
{start: 100, end: 200},{start: 0, end: 100},
],
// color: ['#ff0', '#ffff00', '#0E94EB','#6FBCF0', '#F0F06F', '#00CC00']
color:['#5bc2e7', '#6980c5', '#70dfdf', '#f7f1ee', '#3390FF']
},
series: [{
name: '各省份的总成交量对比',
type: 'map',
mapType: 'china',
label: {
normal: {
show: false
},
emphasis: {
show: false
}
},
data:mydata
}]
};
mapChart.setOption(option);
}
initOption()
// 响应式调整
window.addEventListener('resize', function() {
bar1.resize();
bar2.resize();
line1.resize();
mapChart.resize();
lineChart2.resize();
pieChart1.resize();
pieChart2.resize();
});
});
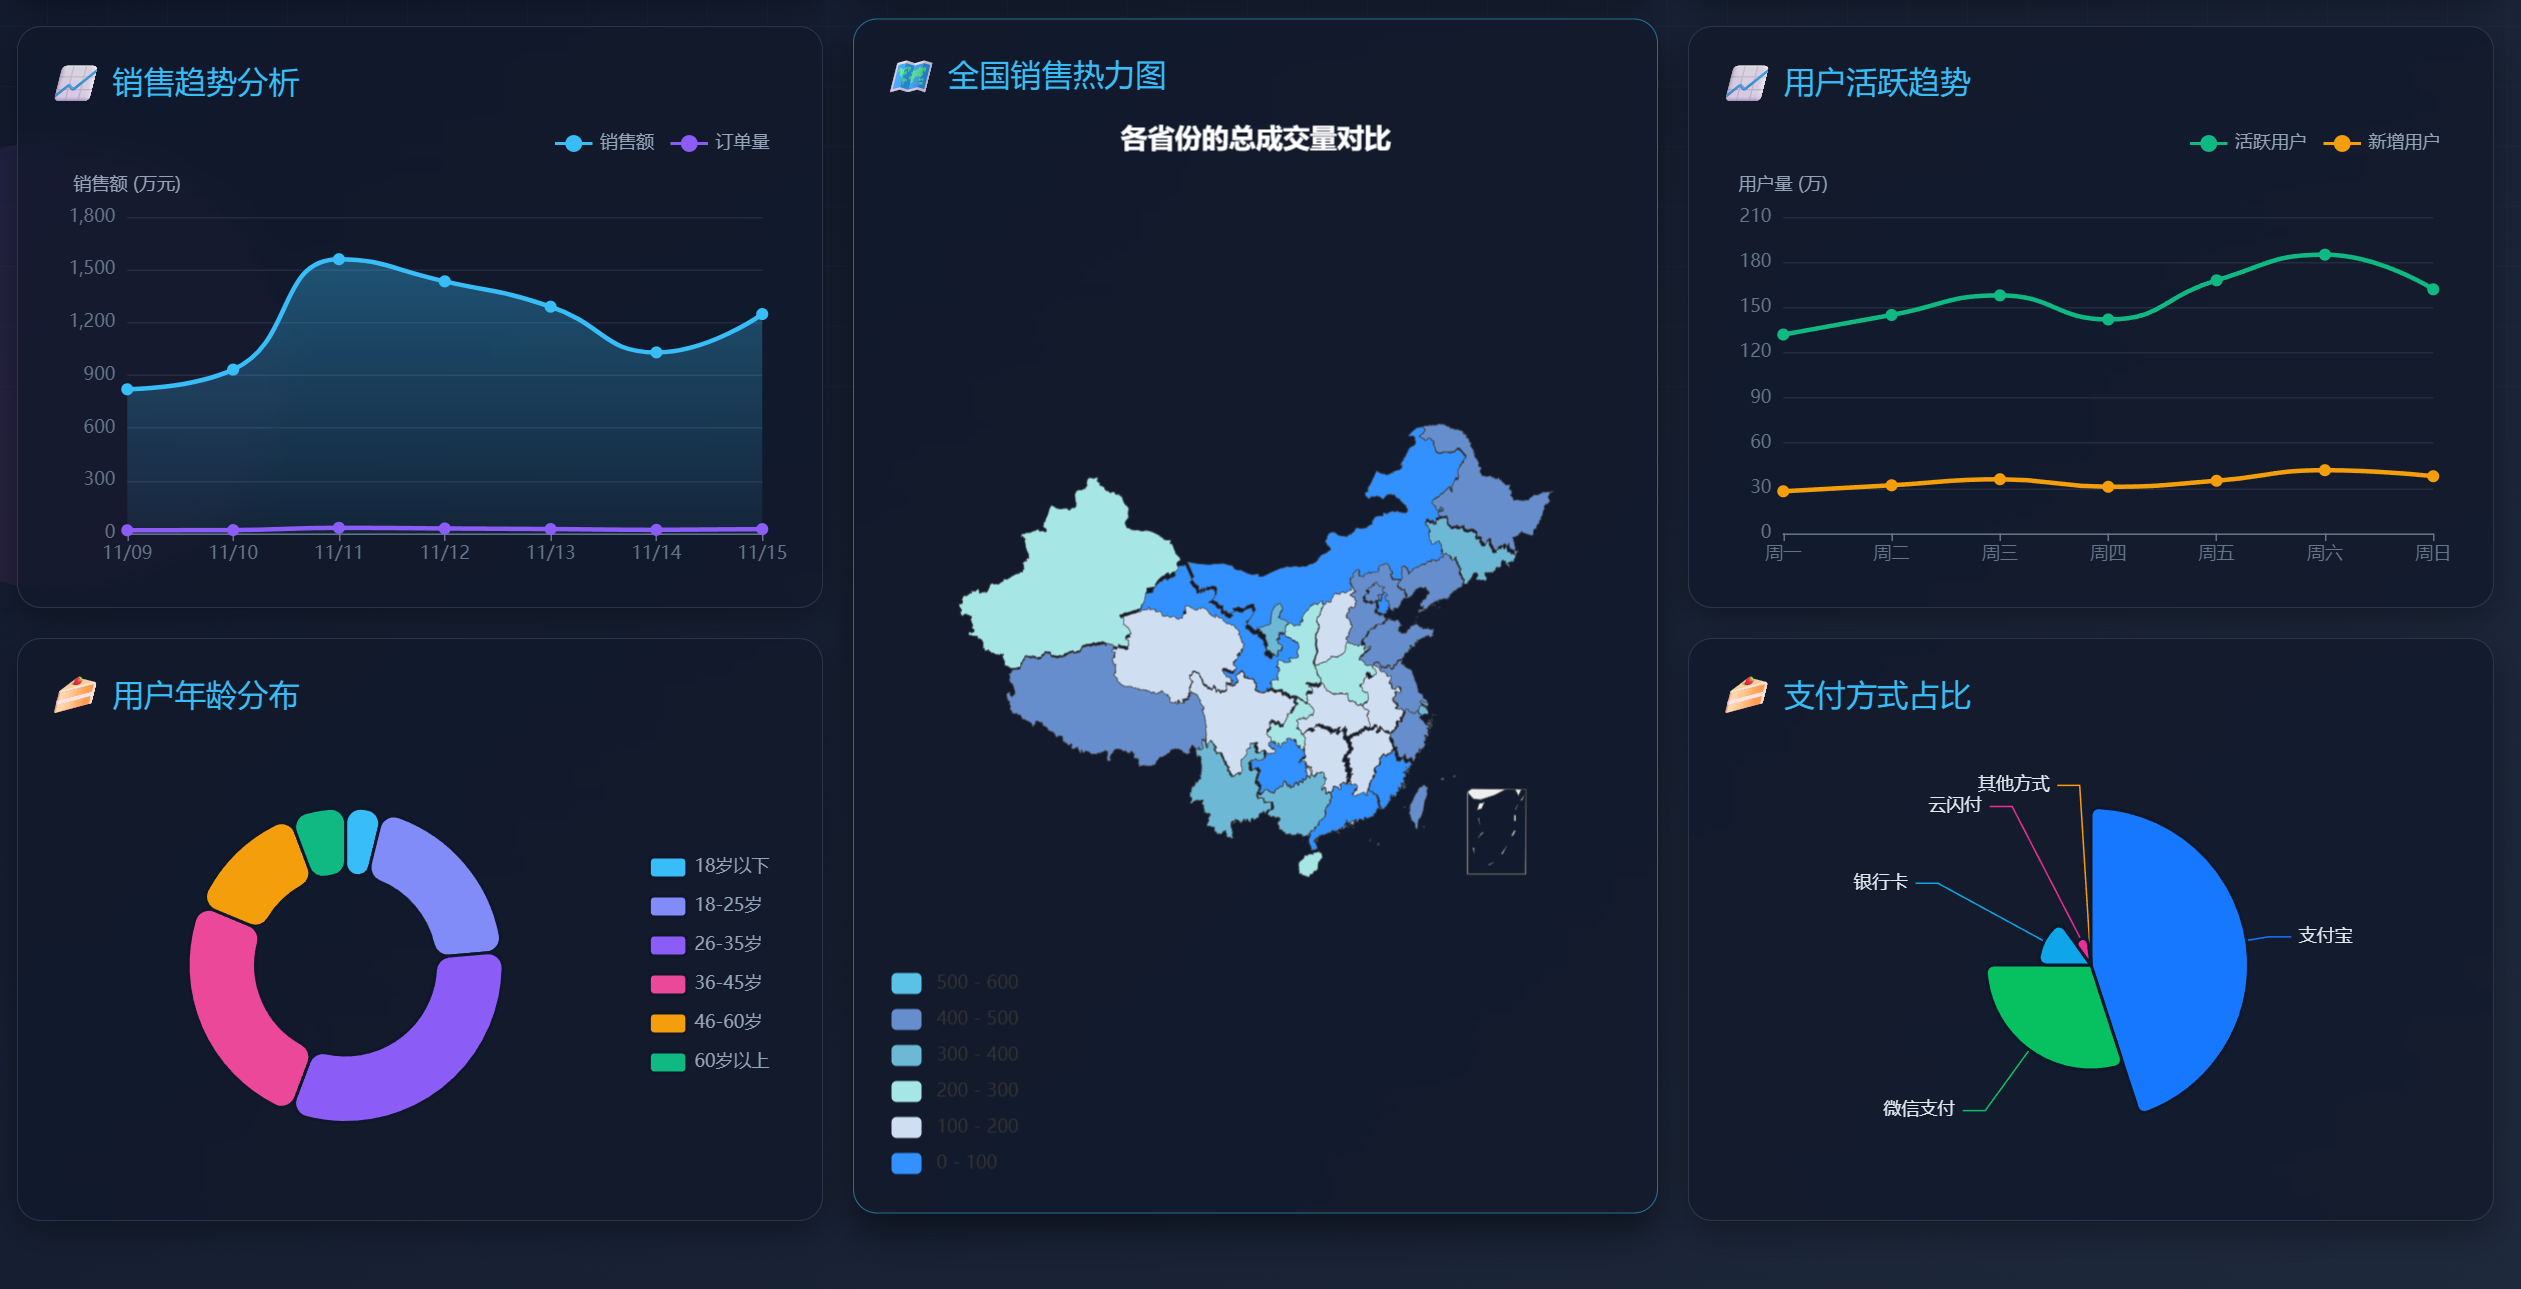
效果图
都能完美实现,没实现成功的看看是否组件导入没,注意啊,这不是vue项目,是纯种的html,嘻嘻。最后实现的效果可能页面太大了,最好都是一页将所有显示出来,所以会前端的大佬可以自己修改,不会前端那就只能让AI改了(我就是)

来源链接:https://www.cnblogs.com/fengyanqiblog/p/18942229
© 版权声明
本站所有资源来自于网络,仅供学习与参考,请勿用于商业用途,否则产生的一切后果将由您(转载者)自己承担!
如有侵犯您的版权,请及时联系3500663466#qq.com(#换@),我们将第一时间删除本站数据。
如有侵犯您的版权,请及时联系3500663466#qq.com(#换@),我们将第一时间删除本站数据。
THE END


暂无评论内容