

demo源码运行环境以及配置
- 运行环境:依赖Node安装环境,demo本地Node版本:推荐v16+。
- 运行工具:vscode或者其他工具。
- 配置方式:下载demo源码,vscode打开,然后顺序执行以下命令:
- (1)下载demo环境依赖包命令:npm i
- (2)启动demo命令:npm run dev
- (3)打包demo命令: npm run build
技术栈
- 前端框架 :Vue 3.5.13
- 地图库 :OpenLayers 10.4.0
- 构建工具 :Vite 6.2.0
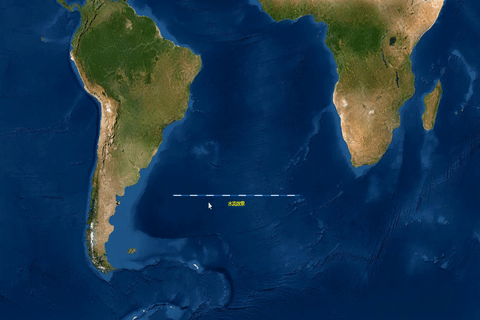
示例效果

大概实现思路如下:
1.创建矢量图层;
2.设置矢量图层样式,以样式组形式;
3.矢量图层样式组底层保持不变,改变矢量图层的要素feature属性值,动态更新顶层样式的线间隔lineDashOffset属性值,达到线水流动效果。
关键点:矢量图层的样式style内部更新渲染机制,在图层可见范围,地图缩放会自动触发;矢量图层的要素设置属性值变化的话,也会触发。
核心源码
<template>
    <div id="map" class="map"></div>
</template>

<script setup>
import { ref, onMounted } from 'vue';
import { Map, View } from 'ol';
import TileLayer from 'ol/layer/Tile';
// import XYZ from 'ol/source/XYZ';
import { OSM, TileArcGISRest, Vector as VectorSource } from 'ol/source';
import 'ol/ol.css';
import VectorLayer from 'ol/layer/Vector';
// import VectorSource from 'ol/source/Vector';
import { Style, Fill, Stroke, Text } from 'ol/style';
import GeoJSON from 'ol/format/GeoJSON';

onMounted(async () => {

    const geojsonObject = {
        'type': 'FeatureCollection',
        'crs': {
            'type': 'name',
            'properties': {
                'name': 'EPSG:3857',
            },
        },
        'features': [
            {
                'type': 'Feature',
                'geometry': {
                    'type': 'LineString',
                    'coordinates': [
                        [-5e6, -5e6],
                        [0, -5e6],
                    ],
                },
            },
        ],
    };
    const vectorSource = new VectorSource({
        features: new GeoJSON().readFeatures(geojsonObject),
    });
    const vectorlayer = new VectorLayer({
        source: vectorSource,
        style: function (feature) {
            //控制显隐
            let style = null;
            style = getStyle(feature, true);
            return style;
        }
    });

    const map = new Map({
        layers: [
            // new TileLayer({
            //   source: new OSM(),
            // }),
            new TileLayer({
                source: new TileArcGISRest({
                    url: "https://services.arcgisonline.com/arcgis/rest/services/World_Imagery/MapServer",
                }),
            }),
            vectorlayer,
        ],
        target: 'map',
        view: new View({
            center: [0, 0],
            zoom: 2,
        }),
    });

    function getStyle(feature, isFlow) {
        let style;
        const geomtype = feature.getGeometry().getType();

        if (geomtype == "LineString") {
            style = getLineStyle(feature, isFlow);
        }
        return style;
    }
    ……
});
</script>

<style scoped>
.map {
    width: 100%;
    height: 100%;
}
</style>
源码下载
GIS之家的学习交流圈
来源链接:https://www.cnblogs.com/giserhome/p/18797255
© 版权声明
本站所有资源来自于网络,仅供学习与参考,请勿用于商业用途,否则产生的一切后果将由您(转载者)自己承担!
如有侵犯您的版权,请及时联系3500663466#qq.com(#换@),我们将第一时间删除本站数据。
如有侵犯您的版权,请及时联系3500663466#qq.com(#换@),我们将第一时间删除本站数据。
THE END


暂无评论内容