rosbag&evo

本文主要介绍Rosbag和evo常用的一些命令。
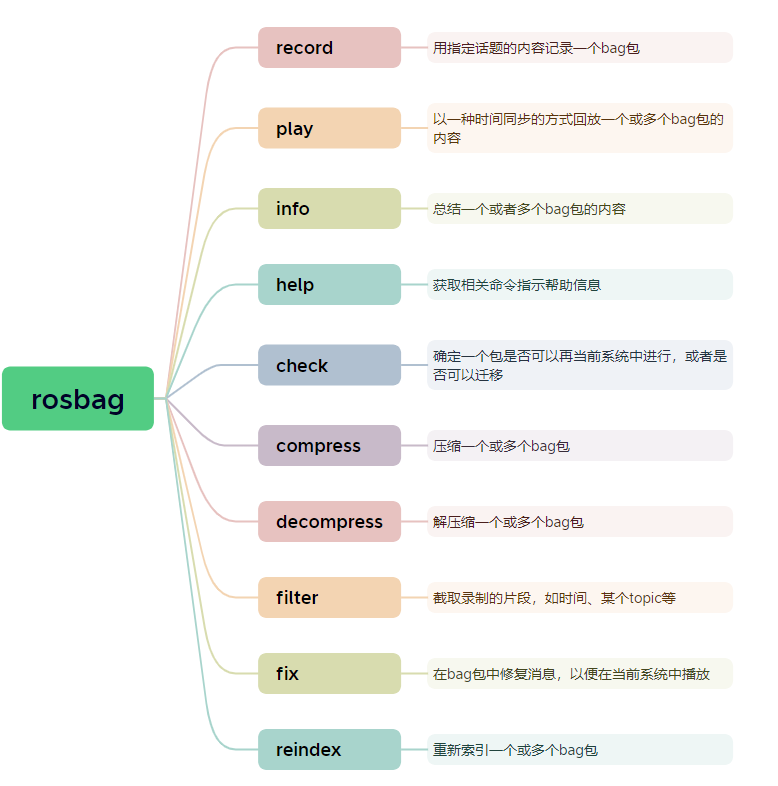
一、rosbag命令详细解读

1. rosbag record 录制时使用
rosbag record -a 录制所有话题 rosbag record -a test.bag 录制所有话题,到指定包下 rosbag record /topic_name 录制指定话题(默认按照录制结束时间命名) rosbag record -O filename.bag /topic_name 指定生成数据包的名字filename.bag并录制指定话题 rosbag record -b 4092 /topic_name 扩大录制内存限制
2. rosbag play 回放时使用
rosbag play name.bag 回放数据包
rosbag play -r 1.5 name.bag 1.5倍速回放,按一定频率回放,-r选项用来设定消息发布速率;
rosbag play -l name.bag 按一定频率回放,-l选项用来设定循环播放;
rosbag play name.bag –topic /topic1 只播放感兴趣的topic;
-d 用来指定延迟播放的时间(sec);
-s 参数用来指定从几秒开始;rosbag play -s 10 xx.bag
-u 参数表示仅播放包的前几秒信息;rosbag play -u 10 xx.bag
-r 参数用来指定播放速度
-l 循环播放
在上述播放命令执行期间,空格键可以暂停播放。
如果想修改topic名字播放
rosbag play file.bag /topic_name:=/reame_topic_name
#//topic_name是原topic,reame_topic_name是新topic
rosbag play --pause record.bag 启动时暂停按空格键开始回放 rosbag play recorded1.bag recorded2.bag 如果播放两个及以上bag包,那么他们会第一帧对其,后面根据第一帧时间戳的时间差播放。

rosbag play -s 5 recorded1.bag 启动5秒进入包中。
回放完后,我一般会用 rostopic list 查看下发布的主题,确保是我需要的:
rostopic list
3. rosbag info 查看bag包的信息
rosbag info 包名.bag #查看录制包的信息
rosbag info -h 用于获取关于 rosbag 工具的更多信息
rosbag info -y name.bag 输出yaml配置参数
rosbag info -y -k duration name.bag 输出 bag 中指定域的信息,比如只显示持续时间rosbag info 显示包文件内容的可读摘要,包括开始和结束时间,主题及其类型,消息计数、频率以及压缩统计信息,常见用法如下:
显示一个 bag 包的信息:
rosbag info name.bag $ rosbag info foo.bag path: foo.bag version: 2.0 duration: 1.2s start: Jun 17 2010 14:24:58.83 (1276809898.83) end: Jun 17 2010 14:25:00.01 (1276809900.01) size: 14.2 KB messages: 119 compression: none [1/1 chunks] types: geometry_msgs/Point [4a842b65f413084dc2b10fb484ea7f17] topics: /points 119 msgs @ 100.0 Hz : geometry_msgs/Point
4. rosbag help 查看帮助信息
rosbag --help
5. rosbag check 检查包
rosbag check xxx.bag 检查一个 bag 在当前系统中是否可以回放
6. rosbag compress 压缩包
rosbag compress xxx.bag 如果录制的 bag 很大,我们可以压缩它,默认的压缩格式是 bz2 rosbag compress -j xxx.bag 可以添加 -j 手动指定压缩格式为 bz2 rosbag compress --lz4 xxx.bag 也可以使用 LZ4 来压缩数据
7. rosbag decompress 解压缩包
rosbag decompress xxx.bag 压缩完后,使用需要解压缩
8. rosbag filter 截取包
rosbag filter temp.bag temp1.bag "topic=='/odom' or topic=='/tf'" rosbag文件提取话题数据,生成temp1.bag只保留/odom,/tf数据 rosbag filter my.bag out.bag "t.to_sec() >= 123564.77 and t.to_sec() <= 794545.88" 过滤,保留某个时间段的数据
rostopic echo -b file_name.bag -p /odom > odom_name.txt 将file_name.bag文件中/odom话题的消息转换到odom_name.txt文件中
9. rosbag fix 修复包
rosbag fix name.bag 修复包(暂时没用)
10. rosbag reindex 备份包
rosbag reindex xxx.bag 如果回放遇到问题,提示 reindex 的话,直接执行即可,这个会自动生成一个原 bag 的备份
11. rosbag 转换格式(bag2txt)
rostopic echo -b file_name.bag -p /topic_name > Txt_name.txt #在bag下将指定话题转换成txt
二、EVO工具使用命令

1. evo_ape命令
计算绝对位姿误差,常被用作绝对轨迹误差。
比较估计轨迹和参考轨迹并计算整个轨迹的统计数据,适用于测试轨迹的全局一致性。
通过 evo_ape +数据格式 + –help查看更多参数的含义以及如何使用(如:evo_ape euroc –help)。
evo_ape  格式  参考轨迹  估计轨迹  [可选项]
#格式:包括kitti、euroc、tum等数据格式
#可选项:有对齐命令、画图、保存结果等
-r  full  ———考虑旋转和平移误差得到的ape,无单位(unit-less) -r trans_part ———考虑平移部分得到的ape,单位为m -r  rot_part  ———考虑旋转部分得到的ape,无单位(unit-less) -r angle_deg ———考虑旋转角得到的ape,单位°(deg) -r angle_rad ———考虑旋转角得到的ape,单位弧度(rad) 不添加-r和可选项,则默认为trans_part
-v ———详细模式/-verbose mode
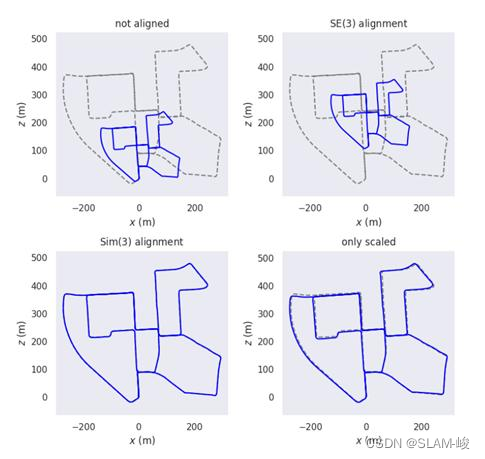
-a ———采用SE(3) Umeyama对齐,只处理平移和旋转(轨迹匹配)
-as ———采用Sim(3) Umeyama对齐,同时处理平移旋转和尺度
-s ———仅对齐尺度(尺度修正)
不添加-s表示默认尺度对齐参数为1.0,即不进行尺度对齐
注:单目SLAM是没有尺度的,所以两个轨迹一定不会一样大)
--plot ———画图 --plot_mode xyz———选择三维xyz画图模式,可选参数[xy, xz, yx, yz, zx, zy, xyz],默认为xyz
--save_plot ———保存画图结果,后接保存路径 --save_result———存储结果,后接保存路径以及压缩文件名称,存储后得到zip压缩文件
栗1:
evo_ape kitti 参轨.txt 估轨.txt -r full --plot --plot_mode xyz #-r full:计算考虑平移和旋转部分误差的ape #省略-a:进行平移和旋转对齐 #省略-v: 以详细模式显示 #–plot: 画图 #–plot_mode: 选择三维xyz画图模式,可选参数为[xy, xz, yx, yz, zx, zy, xyz],默认为xyz
栗2:
#多个轨迹画到一起 evo_traj tum 1**.txt 2**.txt --ref 1**.txt -va -p #其中ref是参考轨迹,-va是对齐后的详细信息,-p是画出图像
栗3:
evo_ape euroc 参轨.csv 估轨.txt -r full -va --plot --plot_mode xyz --save_plot ./VINSplot --save_results ./VINS.zip #VINSplot: 表示存储在当前路径下的名称为VINSplot的文件中。 #保存文件的类型可以通过evo_config设置。 #常见的可以保存成png,pdf等,详见evo_config部分
栗4:
evo_ape kitti a.txt b.txt
#不进行画图
此时的终端输出为:
max:表示最大误差;
mean:平均误差;
median:误差中位数;
min:最小误差;
rmse:均方根误差;
sse:和方差、误差平方和;
std:标准差。
2. evo_rpe命令
evo_rpe是相对位姿评估工具,evo_ape是绝对位姿评估工具。
两者使用方式基本一样
3. evo_traj命令
evo_traj 命令用于绘制轨迹,比较两个 topic 数据之间的的偏差 ,输出轨迹文件,转换数据格式等功能。evo共支持kitti、tum、euroc这三个公开数据集格式,同时也支持bag文件里的topic。
evo_traj bag 包名.bag /话题名1 /话题名2 .... -p //该命令:适用于一个录制包下,相同消息类型的话题 //参数-p 可绘制出轨迹的图形,两个 topic 对应的坐标曲线。
evo_traj可以将轨迹转换成其他格式(因euroc格式只对euroc数据集的groundtruth数据有意义,所以没有–save_as_euroc)。
| * | –save_as_bag | –save_as_kitti | –save_as_tum |
|---|---|---|---|
| bag | yes | yes | yes |
| euroc | yes | yes | yes |
| kitti | no(no timestamps) | yes | no(no timestamps) |
| tum | yes | yes | yes |
evo_traj euroc data.csv --save_as_tum #将euroc转换成tum格式
ps:可通过 evo_traj +数据格式 + –help查看更多参数的含义以及使用(evo_traj euroc –help )
4. evo_res命令
学习evo_res指令的使用
参数含义
查看帮助
evo_res –help
usage: evo_res [-h] [–merge] [–use_rel_time] [–use_filenames]
[–ignore_title] [-p] [–plot_markers] [–save_plot SAVE_PLOT]
[–serialize_plot SERIALIZE_PLOT] [–save_table SAVE_TABLE]
[–logfile LOGFILE] [–no_warnings] [-v] [–silent] [–debug]
[-c CONFIG]
result_files [result_files …]tool for processing one or multiple result files (c) evo authors
positional arguments:
result_files one or multiple result filesoptional arguments:
-h, –help show this help message and exit
–merge merge the results into a single one
–use_rel_time use relative timestamps if available
–use_filenames use the filenames to label the data
–ignore_title don’t try to find a common metric titleoutput options:
-p, –plot show plot window
–plot_markers plot with circle markers
–save_plot SAVE_PLOT
path to save plot
–serialize_plot SERIALIZE_PLOT
path to serialize plot (experimental)
–save_table SAVE_TABLE
path to a file to save the results in a table
–logfile LOGFILE Local logfile path.usability options:
–no_warnings no warnings requiring user confirmation
-v, –verbose verbose output
–silent don’t print any output
–debug verbose output with additional debug info
-c CONFIG, –config CONFIG
.json file with parameters (priority over command line
翻译之后
evo_res –help
usage: evo_res [-h] [–merge] [–use_rel_time] [–use_filenames]
[–ignore_title] [-p] [–plot_markers] [–save_plot SAVE_PLOT]
[–serialize_plot SERIALIZE_PLOT] [–save_table SAVE_TABLE]
[–logfile LOGFILE] [–no_warnings] [-v] [–silent] [–debug]
[-c CONFIG]
result_files [result_files …]
tool for processing one or multiple result files (c) evo authors
用于处理一个或多个结果文件的工具(c)evo作者
positional arguments:位置参数:
result_files one or multiple result filesresult_file一个或多个结果文件
optional arguments:可选参数:
-h, –help show this help message and exit 显示此帮助消息并退出
–merge merge the results into a single one将结果合并为一个结果
–use_rel_time use relative timestamps if available可以的话请使用相对时间戳
–use_filenames use the filenames to label the data使用文件名标记数据
–ignore_title don’t try to find a common metric title不尝试查找通用度量标题
output options:输出选项:
-p, –plot show plot window绘图显示绘图窗口
–plot_markers plot with circle markers使用圆形标记打印
–save_plot SAVE_PLOT
path to save plot保存绘图的路径
–serialize_plot SERIALIZE_PLOT
path to serialize plot (experimental)序列化绘图的路径(实验)
–save_table SAVE_TABLE
path to a file to save the results in a table将结果保存在表中的文件的路径
–logfile LOGFILE Local logfile path.本地日志文件路径。
usability options:可用性选项:
–no_warnings no warnings requiring user confirmation无需用户确认的警告
-v, –verbose verbose output详细输出
–silent don’t print any output不打印任何输出
–debug verbose output with additional debug info使用附加调试信息调试详细输出
-c CONFIG, –config CONFIG
.json file with parameters (priority over command line带有参数的.json文件(优先级高于命令行效果演示
按需使用
以VINS的输出轨迹为例,演示各参数实际效果
evo_res no_l.zip l.zip
$ evo_res no_l.zip l.zip
APE w.r.t. translation part (m)
(with Sim(3) Umeyama alignment)max mean median min rmse \
vins_result_no_lo… 0.438398 0.148959 0.131542 0.0218703 0.170383
vins_result_loop.txt 0.384438 0.156007 0.141948 0.0109087 0.185972sse std
vins_result_no_lo… 3.33851 0.0827144
vins_result_loop.txt 0.795467 0.10123
evo_res no_l.zip l.zip -v
-v, –verbose verbose output详细输出
$ evo_res no_l.zip l.zip -v
Loading result from no_l.zip …
Loading result from l.zip …
——————————————————————————–
Aggregated dataframe:
vins_result_no_loop.txt vins_result_loop.txt
info est_name vins_result_no_l… vins_result_loop…
label APE (m) APE (m)
ref_name gt.txt gt.txt
title APE w.r.t. trans… APE w.r.t. trans…
np_arrays error_array [0.2435494878540… [0.2465613955623…
seconds_from_start [0.0, 0.13390660… [0.0, 0.53564167…
timestamps [1627729515.8364… [1627729518.7817…
stats max 0.438398 0.384438
mean 0.148959 0.156007
median 0.131542 0.141948
min 0.0218703 0.0109087
rmse 0.170383 0.185972
sse 3.33851 0.795467
std 0.0827144 0.10123
——————————————————————————–APE w.r.t. translation part (m)
(with Sim(3) Umeyama alignment)max mean median min rmse \
vins_result_no_lo… 0.438398 0.148959 0.131542 0.0218703 0.170383
vins_result_loop.txt 0.384438 0.156007 0.141948 0.0109087 0.185972sse std
vins_result_no_lo… 3.33851 0.0827144
vins_result_loop.txt 0.795467 0.10123
输出相关指令
evo_res no_l.zip l.zip -p
-p, –plot show plot window绘图显示绘图窗口
$ evo_res no_l.zip l.zip -p
APE w.r.t. translation part (m)
(with Sim(3) Umeyama alignment)max mean median min rmse \
vins_result_no_lo… 0.438398 0.148959 0.131542 0.0218703 0.170383
vins_result_loop.txt 0.384438 0.156007 0.141948 0.0109087 0.185972sse std
vins_result_no_lo… 3.33851 0.0827144
vins_result_loop.txt 0.795467 0.10123
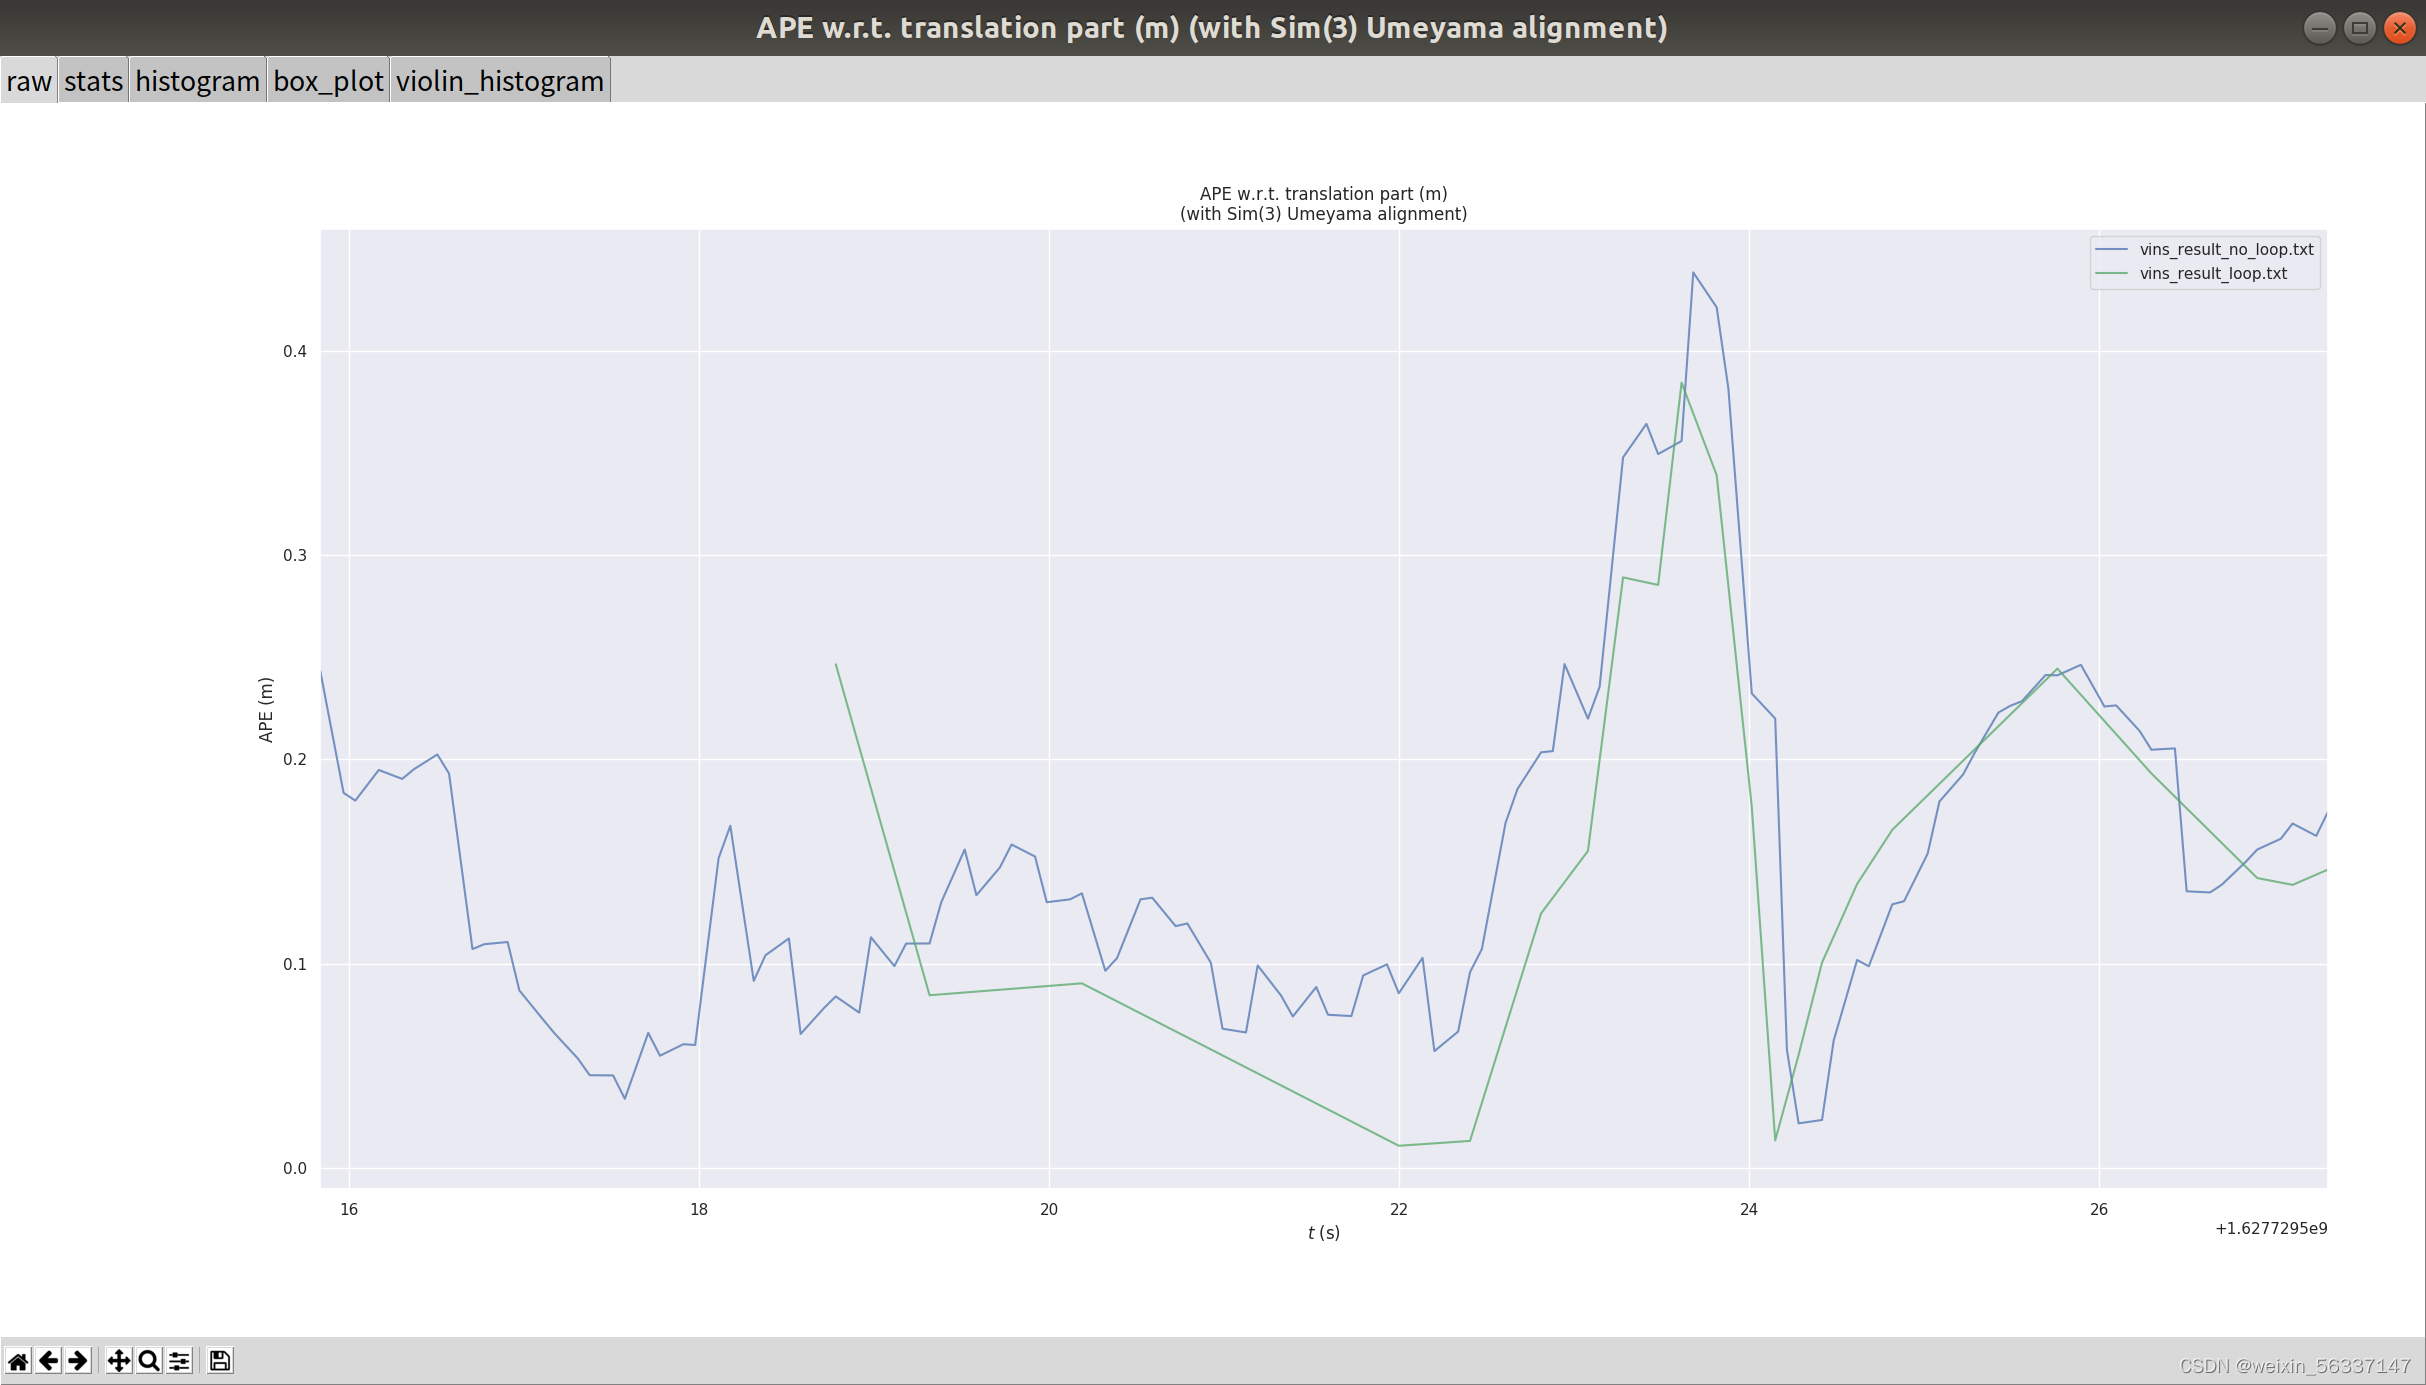
绘图共有5个标签。
evo_res no_l.zip l.zip -p –plot_markers
–plot_markers plot with circle markers使用圆形标记打印
$ evo_reso_l.zip l.zip -p –plot_markers
APE w.r.t. translation part (m)
(with Sim(3) Umeyama alignment)max mean median min rmse \
vins_result_no_lo… 0.438398 0.148959 0.131542 0.0218703 0.170383
vins_result_loop.txt 0.384438 0.156007 0.141948 0.0109087 0.185972sse std
vins_result_no_lo… 3.33851 0.0827144
vins_result_loop.txt 0.795467 0.10123
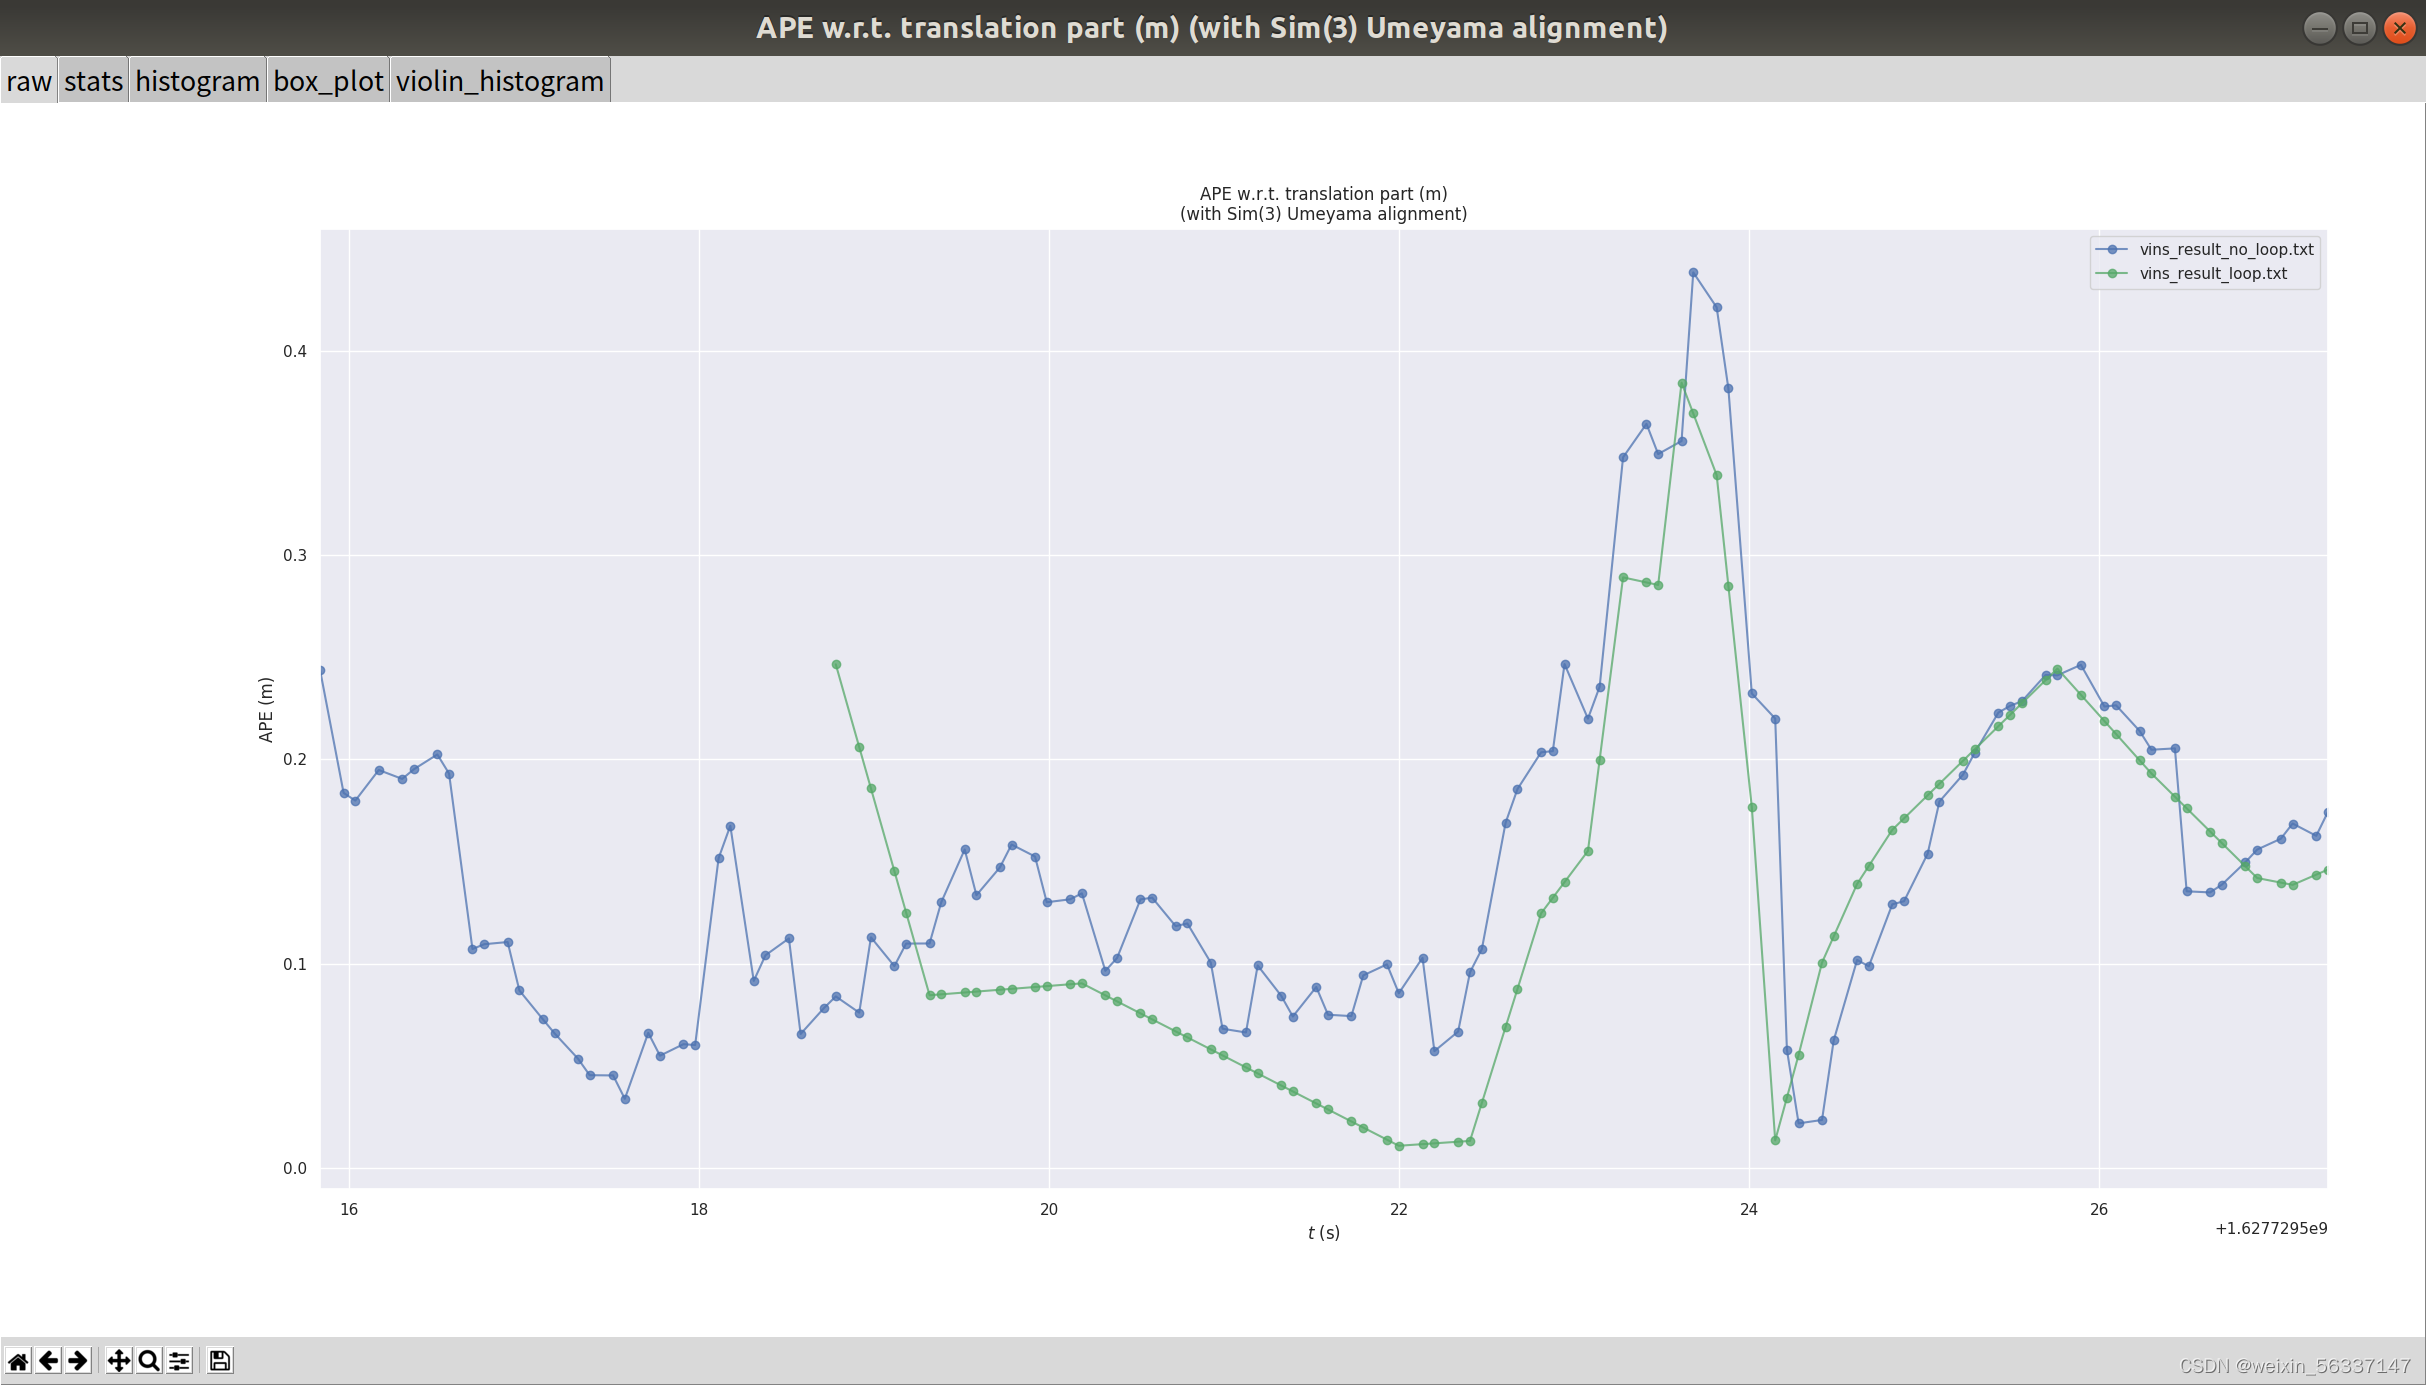
加了–plot_markers之后主要是在raw绘图使用大圆点这一差别。
evo_res no_l.zip l.zip –save_plot ./plot.pdf
–save_plot SAVE_PLOT path to save plot保存绘图的路径
$ evo_res no_l.zip l.zip –save_plot ./plot.pdf
APE w.r.t. translation part (m)
(with Sim(3) Umeyama alignment)max mean median min rmse \
vins_result_no_lo… 0.438398 0.148959 0.131542 0.0218703 0.170383
vins_result_loop.txt 0.384438 0.156007 0.141948 0.0109087 0.185972sse std
vins_result_no_lo… 3.33851 0.0827144
vins_result_loop.txt 0.795467 0.10123Plots saved to ./plot.pdf
save_plot保存图片为pdf文件,SAVE_PLOT不要用文件夹路径或者其他文件后缀名的路径,最好是pdf文件后缀的路径或者无后缀的文件的路径。
evo_res no_l.zip l.zip –serialize_plot ./serial
–serialize_plot SERIALIZE_PLOT
path to serialize plot (experimental)序列化绘图的路径(实验)
$ evo_res no_l.zip l.zip –serialize_plot ./serial
APE w.r.t. translation part (m)
(with Sim(3) Umeyama alignment)max mean median min rmse \
vins_result_no_lo… 0.438398 0.148959 0.131542 0.0218703 0.170383
vins_result_loop.txt 0.384438 0.156007 0.141948 0.0109087 0.185972sse std
vins_result_no_lo… 3.33851 0.0827144
vins_result_loop.txt 0.795467 0.10123
当前文件夹下生成一个serial文件,内容无法直观理解。
evo_res no_l.zip l.zip –save_table ./table.txt
–save_table SAVE_TABLE
path to a file to save the results in a table将结果保存在表中的文件的路径
$ evo_res no_l.zip l.zip –save_table ./table.txt
APE w.r.t. translation part (m)
(with Sim(3) Umeyama alignment)max mean median min rmse \
vins_result_no_lo… 0.438398 0.148959 0.131542 0.0218703 0.170383
vins_result_loop.txt 0.384438 0.156007 0.141948 0.0109087 0.185972sse std
vins_result_no_lo… 3.33851 0.0827144
vins_result_loop.txt 0.795467 0.10123
保存结果到table.txt文件中,文件内容:
,max,mean,median,min,rmse,sse,std
vins_result_no_loop.txt,0.4383977275594648,0.1489591297376942,0.13154172411967663,0.021870345732747924,0.1703833880551451,3.338507376392269,0.08271442796114209
vins_result_loop.txt,0.38443759977911424,0.15600665868307592,0.14194846352691584,0.01090871540602807,0.1859718638015804,0.7954672848941721,0.10122972178355431
evo_res no_l.zip l.zip –logfile ./log
–logfile LOGFILE Local logfile path本地日志文件路径
$ evo_res no_l.zip l.zip –logfile ./log
APE w.r.t. translation part (m)
(with Sim(3) Umeyama alignment)max mean median min rmse \
vins_result_no_lo… 0.438398 0.148959 0.131542 0.0218703 0.170383
vins_result_loop.txt 0.384438 0.156007 0.141948 0.0109087 0.185972sse std
vins_result_no_lo… 3.33851 0.0827144
vins_result_loop.txt 0.795467 0.10123
保存结果到本地文件中,文件内容包含-v参数的输出结果和简单的[DEBUG]信息。
其他参数
evo_res no_l.zip l.zip –use_filenames
–use_rel_time use relative timestamps if available可以的话请使用相对时间戳
$ evo_res no_l.zip l.zip –use_filenames
APE w.r.t. translation part (m)
(with Sim(3) Umeyama alignment)max mean median min rmse sse \
no_l.zip 0.438398 0.148959 0.131542 0.0218703 0.170383 3.33851
l.zip 0.384438 0.156007 0.141948 0.0109087 0.185972 0.795467std
no_l.zip 0.0827144
l.zip 0.10123
evo_res no_l.zip l.zip –ignore_title
–ignore_title don’t try to find a common metric title不尝试查找通用度量标题
$ evo_res no_l.zip l.zip –ignore_title
max mean median min rmse \
vins_result_no_lo… 0.438398 0.148959 0.131542 0.0218703 0.170383
vins_result_loop.txt 0.384438 0.156007 0.141948 0.0109087 0.185972sse std
vins_result_no_lo… 3.33851 0.0827144
vins_result_loop.txt 0.795467 0.10123
evo_res no_l.zip l.zip –silent
–silent don’t print any output不打印任何输出
$ evo_res no_l.zip l.zip –silent
evo_res no_l.zip l.zip –debug
–debug verbose output with additional debug info使用附加调试信息调试详细输出
$ evo_res no_l.zip l.zip –debug
[DEBUG][2023-12-12 20:39:55,923][log.configure_logging():114]
System info:
Python 2.7.17
Linux-5.4.0-113-generic-x86_64-with-Ubuntu-18.04-bionic
[DEBUG][2023-12-12 20:39:55,923][main_res.run():132]
main_parser config:
{‘config’: None,
‘debug’: True,
‘ignore_title’: False,
‘logfile’: None,
‘merge’: False,
‘no_warnings’: False,
‘plot’: False,
‘plot_markers’: False,
‘result_files’: [‘no_l.zip’, ‘l.zip’],
‘save_plot’: None,
‘save_table’: None,
‘serialize_plot’: None,
‘silent’: False,
‘use_filenames’: False,
‘use_rel_time’: False,
‘verbose’: False}[DEBUG][2023-12-12 20:39:55,924][file_interface.load_res_file():358]
Loading result from no_l.zip …
[DEBUG][2023-12-12 20:39:55,928][file_interface.load_res_file():358]
Loading result from l.zip …
[DEBUG][2023-12-12 20:39:55,933][main_res.run():202]
——————————————————————————–
[DEBUG][2023-12-12 20:39:55,936][main_res.run():204]
Aggregated dataframe:
vins_result_no_loop.txt vins_result_loop.txt
info est_name vins_result_no_l… vins_result_loop…
label APE (m) APE (m)
ref_name gt.txt gt.txt
title APE w.r.t. trans… APE w.r.t. trans…
np_arrays error_array [0.2435494878540… [0.2465613955623…
seconds_from_start [0.0, 0.13390660… [0.0, 0.53564167…
timestamps [1627729515.8364… [1627729518.7817…
stats max 0.438398 0.384438
mean 0.148959 0.156007
median 0.131542 0.141948
min 0.0218703 0.0109087
rmse 0.170383 0.185972
sse 3.33851 0.795467
std 0.0827144 0.10123
[DEBUG][2023-12-12 20:39:55,936][main_res.run():207]
——————————————————————————–
[INFO][2023-12-12 20:39:55,936][main_res.run():209]APE w.r.t. translation part (m)
(with Sim(3) Umeyama alignment)[INFO][2023-12-12 20:39:55,938][main_res.run():210]
max mean median min rmse \
vins_result_no_lo… 0.438398 0.148959 0.131542 0.0218703 0.170383
vins_result_loop.txt 0.384438 0.156007 0.141948 0.0109087 0.185972sse std
vins_result_no_lo… 3.33851 0.0827144
vins_result_loop.txt 0.795467 0.10123
效果不明显的参数
受限于笔者所使用的zip,有些指令的效果并不明显。
evo_res no_l.zip l.zip –use_rel_time
可以的话请使用相对时间戳
$ evo_res no_l.zip l.zip –use_rel_time
APE w.r.t. translation part (m)
(with Sim(3) Umeyama alignment)max mean median min rmse \
vins_result_no_lo… 0.438398 0.148959 0.131542 0.0218703 0.170383
vins_result_loop.txt 0.384438 0.156007 0.141948 0.0109087 0.185972sse std
vins_result_no_lo… 3.33851 0.0827144
vins_result_loop.txt 0.795467 0.10123
evo_res no_l.zip l.zip –no_warnings
–no_warnings no warnings requiring user confirmation无需用户确认的警告
$ evo_res no_l.zip l.zip –no_warnings
APE w.r.t. translation part (m)
(with Sim(3) Umeyama alignment)max mean median min rmse \
vins_result_no_lo… 0.438398 0.148959 0.131542 0.0218703 0.170383
vins_result_loop.txt 0.384438 0.156007 0.141948 0.0109087 0.185972sse std
vins_result_no_lo… 3.33851 0.0827144
vins_result_loop.txt 0.795467 0.10123
无警告,因此no_warnings的效果不明显。
总结
1.evo_res可以处理多条轨迹
evo_res no_l.zip l.zip result3.zip -p
2.详细数据使用-v参数,但是也没有多么详细。
3.绘图
evo_res no_l.zip l.zip -p
保存图片使用 –save_plot SAVE_PLOT参数。
5. evo_fig命令
`evo_fig` 是 EVO 工具集中的一个实验性工具,其主要作用是用于重新打开之前使用 `–serialize_plot` 选项保存的序列化图。这个功能允许用户在不重新运行原始分析的情况下,重新加载和查看序列化后的图形。以下是 `evo_fig` 的主要用法:
1. 重新打开序列化图:
使用 `evo_fig` 命令,后跟序列化图的文件路径,可以重新打开该图。例如,如果之前使用 `evo_ape` 或 `evo_rpe` 命令生成并保存了一个序列化图,可以使用以下命令重新打开它:
evo_fig path_to_serialized_plot
这里 `path_to_serialized_plot` 是序列化图文件的路径。
2. 查看和分析图形:
重新打开的图形可以用于进一步的查看和分析,这在需要对图形进行详细检查或展示时非常有用。
`evo_fig` 命令不常用于日常的 EVO 操作,因为它主要针对的是已经生成并序列化的图形。这个工具在需要回顾或共享序列化图形时特别有用,因为它允许用户在没有原始数据或分析环境的情况下查看图形。
6.evo_config命令
evo_config show——查看设置文件中的参数和参数的简要注释
evo_config set以下参数:(evo配置工具)
| 参数 | 含义 | 可选项 |
|---|---|---|
| plot_export_format | 输出图像时图像存储格式 | 常用png,pdf等 |
| plot_linewidth | 作图时线的宽度 | matplotlib支持的宽度,默认1.5 |
| plot_reference_color | 图像中参考轨迹的颜色 | black,red,green等 |
| plot_reference_linestyle | 参考轨迹的线型 | matplotlib支持的线型,默认– |
| plot_seaborn_style | 图像背景和网格 | whitegrid,darkgrid,white,dark |
| plot_split | 是否分开显示/存储图像 | false/true |
| plot_figsize | 画图的图像大小 | 默认宽高均为6,可使用其他值 |
| table_export_format | 表格数据输出格式 | 常用 csv,excel,latex,json |
例如: evo_config set plot_seaborn_style whitegrid 将画图背景更改成白色网格 evo_config set plot_fontfamily serif plot_fontscale 1.2 将字体改为衬线型并调为1.2倍大小 evo_config set plot_reference_linestyle - 将画图所使用的线型改为 - evo_config set plot_figsize 10 9 将所画图的图像大小调整为10 9(宽 高) evo_config reset 将参数还原到默认值
evo_config命令并不怎么常用,多数情况下,我们正常使用是不需要额外设置evo的一些配置项的。
你可以使用如下命令,查看evo默认的一些系统参数设置:
evo_config show --brief
运行上面的命令之后,你的终端上就可以输出如下信息:
{ "console_logging_format": "%(message)s", "euler_angle_sequence": "sxyz", "global_logfile_enabled": false, "plot_axis_marker_scale": 0.0, "plot_backend": "Qt5Agg", "plot_export_format": "pdf", "plot_figsize": [ 6, 6 ], "plot_fontfamily": "sans-serif", "plot_fontscale": 1.0, "plot_invert_xaxis": false, "plot_invert_yaxis": false, "plot_linewidth": 1.5, "plot_multi_cmap": "none", "plot_reference_alpha": 0.5, "plot_reference_color": "black", "plot_reference_linestyle": "--", "plot_seaborn_palette": "deep6", "plot_seaborn_style": "darkgrid", "plot_split": false, "plot_statistics": [ "rmse", "median", "mean", "std", "min", "max" ], "plot_texsystem": "pdflatex", "plot_trajectory_alpha": 0.75, "plot_trajectory_cmap": "jet", "plot_trajectory_linestyle": "-", "plot_usetex": false, "plot_xyz_realistic": true, "ros_map_alpha_value": 1.0, "ros_map_unknown_cell_value": 205, "save_traj_in_zip": false, "table_export_data": "stats", "table_export_format": "csv", "table_export_transpose": true }
如果你想要对某一项参数进行修改,比如你想修改输出的图像格式,你可以使用如下命令:
evo_config set plot_export_format png
又比如你想做如下的操作:
1.将画图背景更改成白色网格
evo_config set plot_seaborn_style whitegrid
2.将字体改为衬线型并调为1.2倍大小
evo_config set plot_fontfamily serif plot_fontscale 1.2
3.将画图所使用的线型改为 –
evo_config set plot_reference_linestyle -
4.将所画图的图像大小调整为10 9(宽 高)
evo_config set plot_figsize 10 9
5.当你想要将配置还原为默认时,只需要使用命令:
evo_config reset
当你对evo的使用有一个大致的理解之后,我觉得你再摸索和使用就会方便很多,当你看完本篇博客之后,如果你还想进一步了解它更细致的使用,你可以浏览的evo在github上的wiki,网址为:https://github.com/MichaelGrupp/evo/wiki
参考文献:
rosbag命令 | EVO工具 的使用_evo bag 绘制轨迹-CSDN博客
ROS 机器人技术 – rosbag 详细使用教程! – 知乎
evo安装、evo使用方法详细介绍使用教程,SLAM轨迹精度评估工具,如何用来评估ORB-SLAM2生成的轨迹精度,评估激光雷达SLAM与视觉SLAM的轨迹精度,量化SLAM的误差_怎么看evo是否安葬成功-CSDN博客
evo_res指令使用及各参数使用效果_evo res-CSDN博客


没有回复内容