效果预览
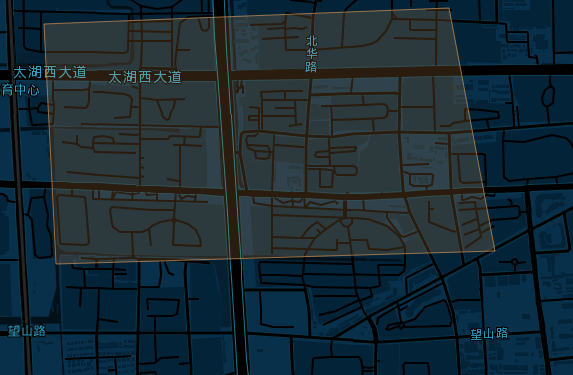
代码
echarts option配置中的series写法如下:
series:[
    {
        type: 'custom',
        coordinateSystem: 'bmap',
        renderItem: (params, api) => renderPolygon(params, api, gArea),
        data: gArea,
        seriesIndex: 1,
    }
]
定义的变量和方法如下:
const gArea = [
    {
        coords: [
            [120.27044133879757, 31.54860147094725],
            [120.27087049223995, 31.541198574066147],
            [120.28666333891964, 31.54160626983641],
            [120.28501109816646, 31.54909499740599],
            [120.27044133879757, 31.54860147094725]
        ],
        style: {
            fill: 'rgba(210, 146, 82, 0.2)', // 多边形填充颜色
            stroke: 'rgba(210, 146, 82, 0.7)',
            lineWidth: 1
        }
    }
]

const renderPolygon = (params, api, gArea) => {
    const points = gArea[params.dataIndex]?.coords;
    return {
        type: 'polygon',
        shape: {
            points: points.map(function (point) {
                return api.coord(point);
            })
        },
        style: gArea[params.dataIndex]?.style,
    };
}
来源链接:https://www.cnblogs.com/ZerlinM/p/18650062




没有回复内容