
🧑 写在开头
点赞 + 收藏 === 学会🤣🤣🤣
vue3封装一个基础甘特图
- 只支持简单展示功能
- 代码通俗易懂
效果图:
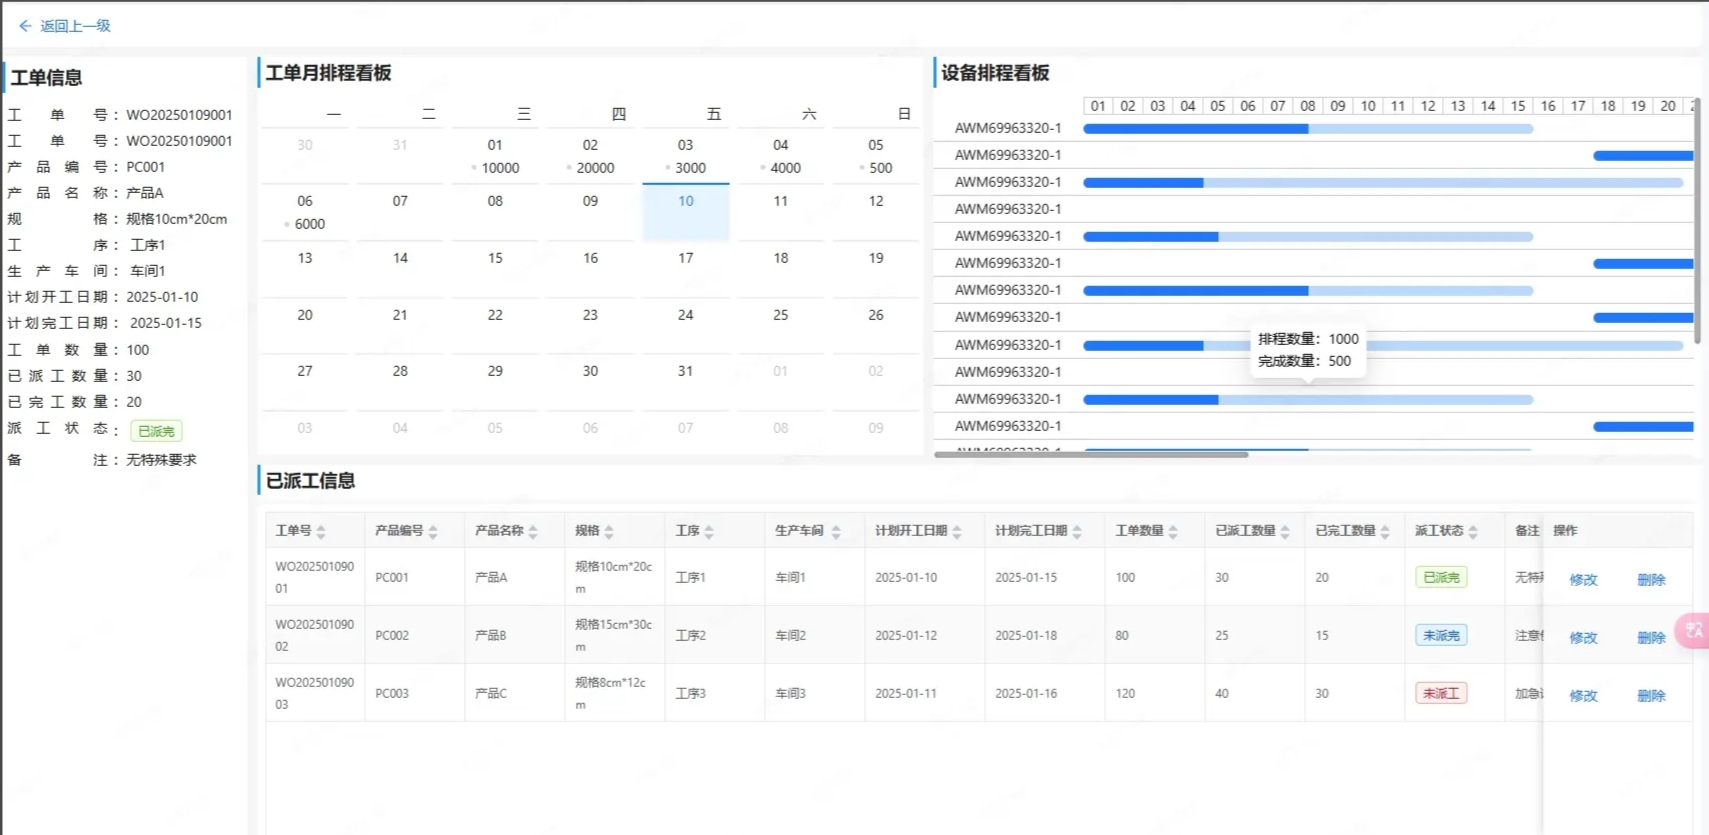
主要计算
- 计算出整体的日期范围
- 根据每项开始时间和结束时间计算出每一项所占的长度

// 基础甘特图封装
import { ref } from 'vue'
import dayjs from 'dayjs'
const data = [
    { order: 'AWM69963320-1', start: '2023-01-01', end: '2023-01-15', progress: 50 },
    { order: 'AWM69963320-1', start: '2023-01-18', end: '2023-02-15', progress: 30 },
    { order: 'AWM69963320-1', start: '2023-01-01', end: '2023-01-20', progress: 20 },
    { order: 'AWM69963320-1', start: '2023-02-18', end: '2023-02-25', progress: 10 },
]
// 日期数组
const dates = ref<string[]>([])
const itemWidth = 30
const init = () => {
    const earliestStart = data.reduce((min, item) => dayjs(item.start).isBefore(dayjs(min)) ? item.start : min, data[0].start)
    const latestEnd = data.reduce((max, item) => dayjs(item.end).isAfter(dayjs(max)) ? item.end : max, data[0].end)
    let currentDate = dayjs(earliestStart)
    let endDate = dayjs(latestEnd).add(1, 'day')
    while (currentDate.isBefore(endDate)) {
        dates.value.push(currentDate.format('YYYY-MM-DD'));
        currentDate = currentDate.add(1, 'day');
    }
}
// 计算每个任务的起始位置和宽度
const calculatePositionAndWidth = (item: any) => {
    const startIndex = dates.value.findIndex((date) => date === item.start)
    const endIndex = dates.value.findIndex((date) => date === item.end)
    const position = startIndex * itemWidth
    const width = (endIndex - startIndex + 1) * itemWidth
    console.log(width, position);
    return { position, width }
}
init()
代码还是非常少的,计算出日期存储到数组中用于渲染头部和每项长度的计算。
- itemWidth: 头部每个日期的宽度(可以根据实际需求自行调整,我这只需要展示日,所以设定的比较短。)
- 渲染每条数据时都调用函数 calculatePositionAndWidth 计算出元素的偏移量和宽度。
- 偏移量:
起始日期在数组中的位置 x 每个日期的宽度(itemWidth) - 实际宽度:
(结束日期在数组中的位置 - 起始日期在数组中的位置 + 1)x 每个日期的宽度(itemWidth),宽度需要加一个单位,这很好理解吧,假设起始日期在0位置,结束日期在1位置,1 – 0 = 1,而实际占了两个位置,所以需要 + 1。 - 有了偏移量和宽度,剩下的就是布局了,完整代码如下。
完整代码
- css中:
--labelWidth: 150px; - –labelWidth: 侧边栏的宽度,相当于 5 个日期长度,
这个长度布局会用到。 - “{ width:
${(dates.length + 5) * itemWidth}px}”,给每一项都赋予宽度,这个 + 5 就是侧边栏的宽度。数据太多太长的,滚动的时候需要固定左侧栏目和顶部日期,利于阅读。如果不指定每一项宽度,可能会导致,底部的border只有一部分。 - 至此,一个简单的甘特图封装完成。
<template>
    <div class="ganttChart">
        <ul class="itemList scrollBar">
            <li class="item header" :style="{ width: `${(dates.length + 5) * itemWidth}px` }">
                <div class="label"></div>
                <div class="dates">
                    <div class="date" :style="{ width: `${itemWidth}px` }" v-for="date in dates" :key="date">{{ date.split('-')[2] }}</div>
                </div>
            </li>
            <li class="item itemData" v-for="item in data" :style="{ width: `${(dates.length + 5) * itemWidth}px` }">
                <div class="label">{{ item.order }}</div>
                <a-tooltip color='white'>
                    <template #title>
                        <div style="color: black;">
                            排程数量:1000
                        </div>
                        <div style="color: black;">
                            完成数量:500
                        </div>
                    </template>
                    <div class="speedOfProgress"
                        :style="{ left: `${calculatePositionAndWidth(item).position}px`, width: `${calculatePositionAndWidth(item).width}px` }">
                        <div class="progress" :style="{ width: `${item.progress}%` }"></div>
                        {{ item.progress }}
                    </div>
                </a-tooltip>
            </li>
        </ul>
    </div>
</template>

<script setup lang="ts">
// 基础甘特图封装
import { ref } from 'vue'
import dayjs from 'dayjs'
const data = [
    { order: 'AWM69963320-1', start: '2023-01-01', end: '2023-01-15', progress: 50 },
    { order: 'AWM69963320-1', start: '2023-01-18', end: '2023-02-15', progress: 30 },
    { order: 'AWM69963320-1', start: '2023-01-01', end: '2023-01-20', progress: 20 },
    { order: 'AWM69963320-1', start: '2023-02-18', end: '2023-02-25', progress: 10 },
    { order: 'AWM69963320-1', start: '2023-01-01', end: '2023-01-15', progress: 30 },
    { order: 'AWM69963320-1', start: '2023-01-18', end: '2023-02-15', progress: 70 },
]
// 日期数组
const dates = ref<string[]>([])
const itemWidth = 30
const init = () => {
    const earliestStart = data.reduce((min, item) => dayjs(item.start).isBefore(dayjs(min)) ? item.start : min, data[0].start)
    const latestEnd = data.reduce((max, item) => dayjs(item.end).isAfter(dayjs(max)) ? item.end : max, data[0].end)
    let currentDate = dayjs(earliestStart)
    let endDate = dayjs(latestEnd).add(1, 'day')
    while (currentDate.isBefore(endDate)) {
        dates.value.push(currentDate.format('YYYY-MM-DD'));
        currentDate = currentDate.add(1, 'day');
    }
}
// 计算每个任务的起始位置和宽度
const calculatePositionAndWidth = (item: any) => {
    const startIndex = dates.value.findIndex((date) => date === item.start)
    const endIndex = dates.value.findIndex((date) => date === item.end)
    const position = startIndex * itemWidth
    const width = (endIndex - startIndex + 1) * itemWidth
    console.log(width, position);
    return { position, width }
}
init()
</script>

<style scoped lang="scss">
.ganttChart {
    --labelWidth: 150px;
    height: calc(100% - 35px);

    .itemList {
        height: 100%;
        position: relative;

        .header {
            position: sticky;
            top: 0;
            background-color: white;
            z-index: 10;
        }


        .item {
            display: grid;
            box-sizing: border-box;
            border-bottom: 1px solid #ccc;
            grid-template-columns: var(--labelWidth) 1fr;

            &:first-child {
                border: none;
            }

            .label {
                position: sticky;
                left: 0;
                background-color: white;
                z-index: 5;
                text-align: center;
            }

            .dates {
                display: flex;
                position: relative;
                background-color: white;

                .date {
                    box-sizing: border-box;
                    border: 1px solid #ccc;
                    text-align: center;
                    border-left: none;

                    &:first-child {
                        border-left: 1px solid #ccc;
                    }
                }
            }

            .speedOfProgress {
                margin-top: 4px;
                height: 10px;
                position: relative;
                background-color: #b9d8fb;
                border-radius: 5px;
                overflow: hidden;
                cursor: pointer;

                .progress {
                    position: absolute;
                    height: 100%;
                    background-color: #27f;
                }
            }
        }

        .itemData {
            padding: 5px 0;
        }
    }
}
</style>
补充滚动条样式
- scrollBar(滚动条样式) 是单独封装在sass文件中的,所以没在原文中显示,补充一下滚动条样式
//滚动条
.scrollBar{
  overflow-y: overlay;

  &::-webkit-scrollbar {
    width: 8px;
    height: 8px;
  }

  &::-webkit-scrollbar-track {
    background: transparent;
  }

  &::-webkit-scrollbar-thumb {
    background-color: #bfbfbf;
    border-radius: 5px;
    border: 1px solid #F1F1F1;
    box-shadow: inset 0 0 6px rgba(0, 0, 0, .3);
  }

  &::-webkit-scrollbar-thumb:hover {
    background-color: #A8A8A8;
  }

  &::-webkit-scrollbar-thumb:active {
    background-color: #787878;
  }

  /*边角,即两个滚动条的交汇处*/
  &::-webkit-scrollbar-corner {
    background-color: #FFFFFF;
  }

}
本文转载于:https://juejin.cn/post/7458107546391117887
如果对您有所帮助,欢迎您点个关注,我会定时更新技术文档,大家一起讨论学习,一起进步。

来源链接:https://www.cnblogs.com/smileZAZ/p/18669116


没有回复内容