


demo源码运行环境以及配置
- 运行环境:依赖Node安装环境,demo本地Node版本:14.19.1。
- 运行工具:vscode或者其他工具。
- 配置方式:下载demo源码,vscode打开,然后顺序执行以下命令:
(1)下载demo环境依赖包命令:npm i
(2)启动demo命令:npm run dev
(3)打包demo命令: npm run build:release
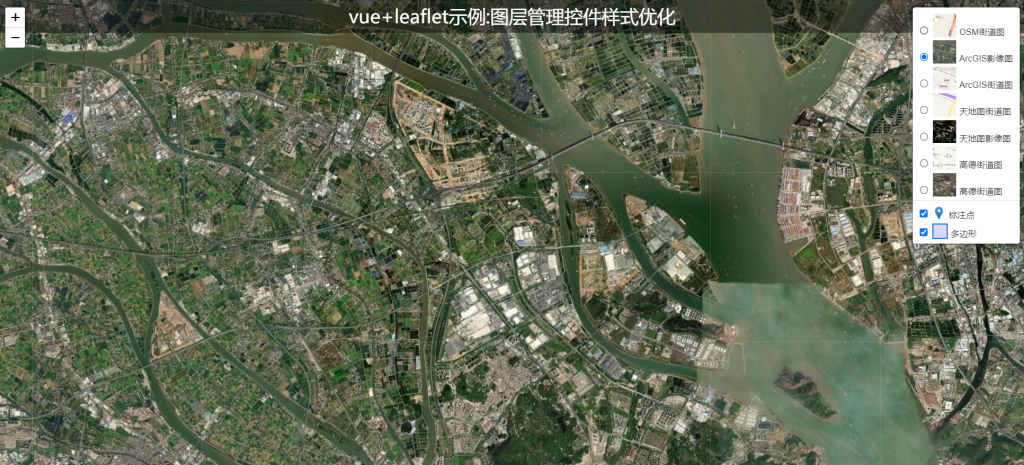
示例效果
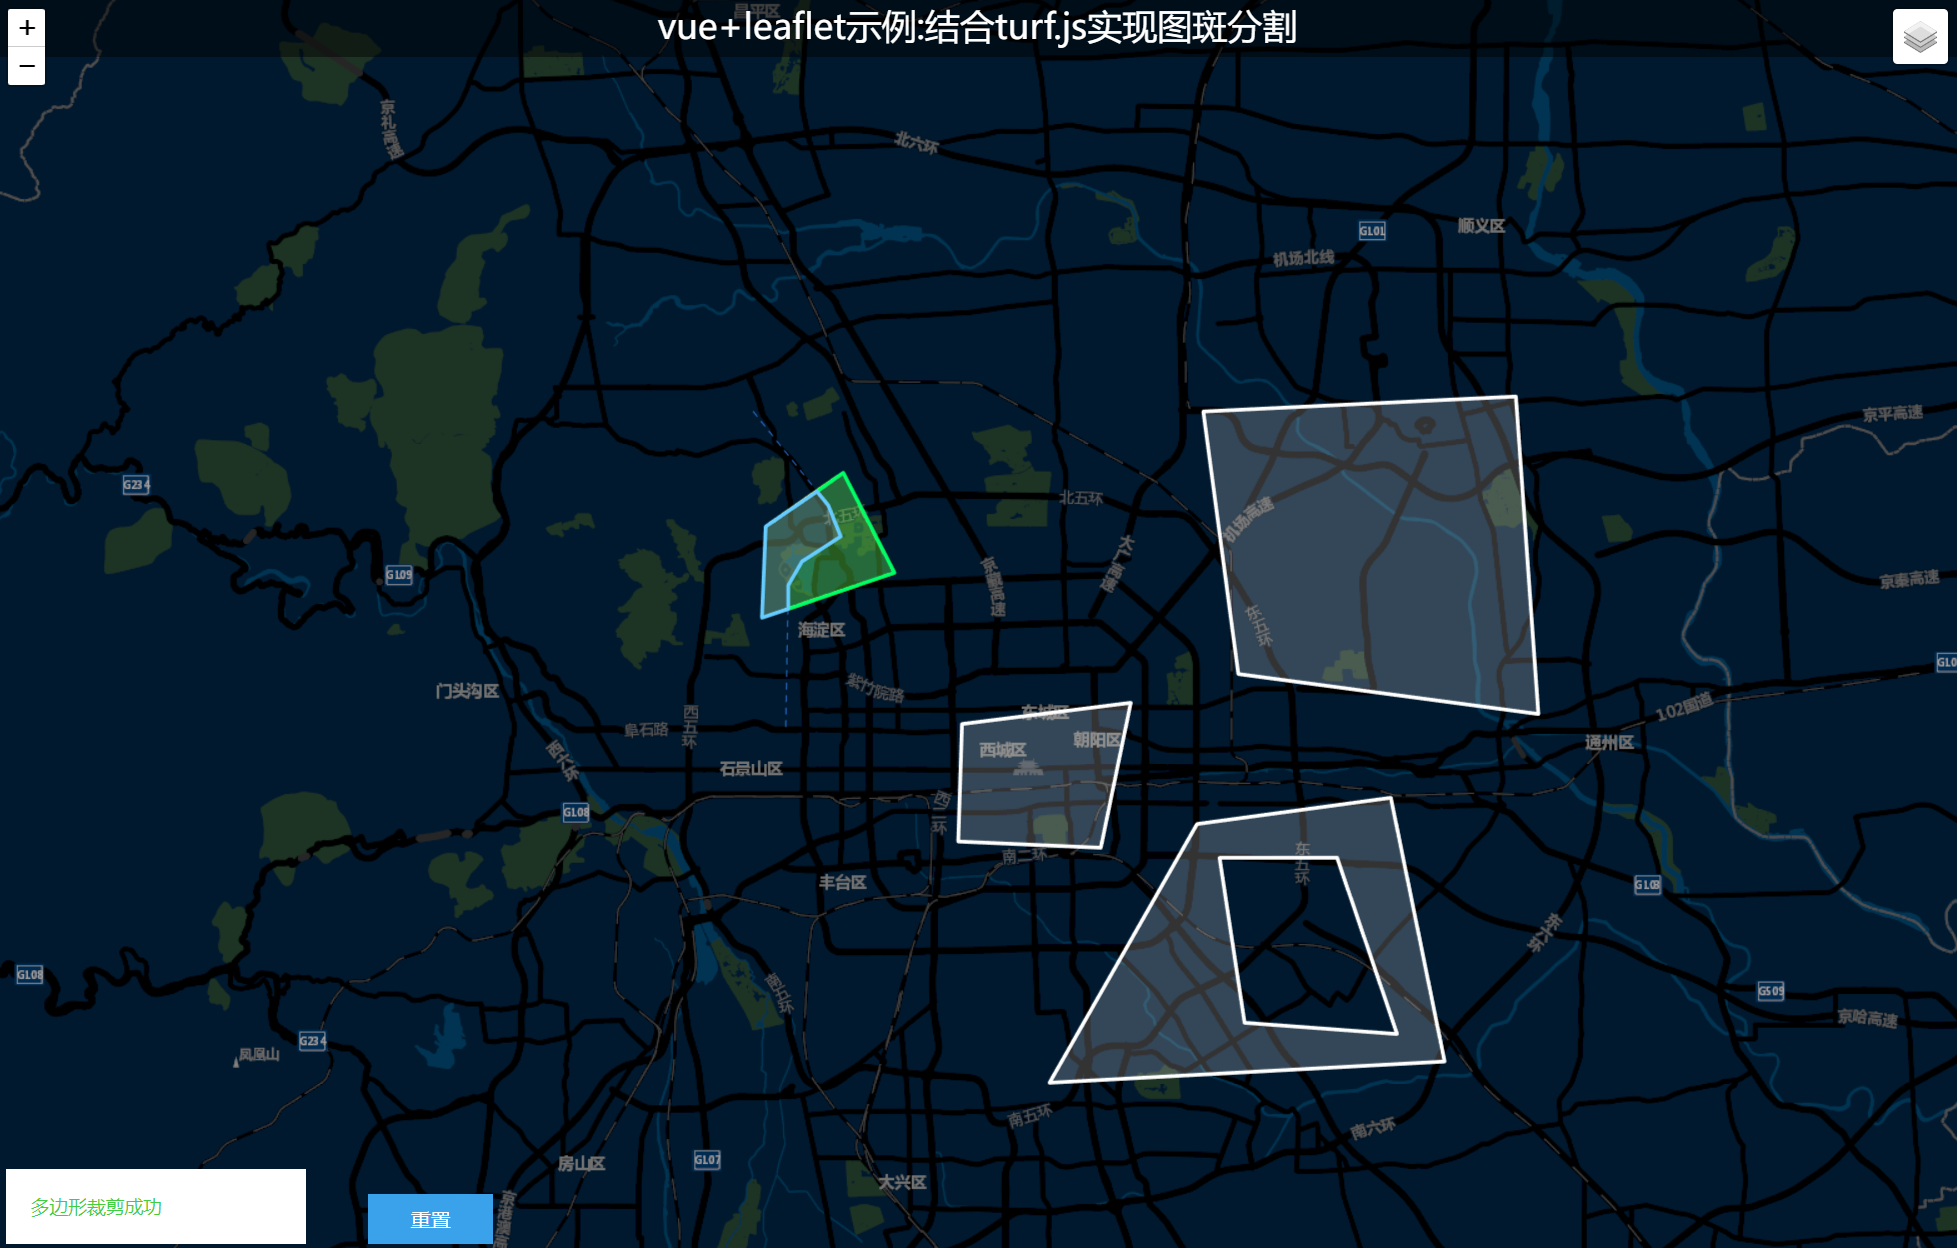
本篇实现的思路:turf.js中提供了一中多边形的裁剪方法是使用多边形去裁剪多边形,但是如果实际工作中需要使用到线去裁剪多边形却无法满足。
- 核心源码
<template>
  <div id="map"></div>
  <div id="msg">先在地图上点击要裁剪的多边形</div>
  <div id="reset" @click="resetClip">重置</div>
  <div class="titleContainer center">
    <span>vue+leaflet示例:结合turf.js实现图斑分割</span>
  </div>
</template>

<script setup>
import { onMounted, reactive, ref } from "vue";
import "./clipSpotMap";
import L from "leaflet";
import "./leaflet.draw.css";
import "./leaflet.draw";
// import config from "../config";
import { useRouter } from "vue-router";
const router = useRouter();
let map = null;
let editLayer = null;
let drawView = null;
let polygonLayer = null;
let clipResultLayer = null;
let clipLineLayer = null;
const colorList = ["#00FF66", "#66CCFF", "#6600FF", "#FF9933", "#FF3333"];
onMounted(() => {
  initMap();
});
const initMap = () => {
  // 创建地图对象
  map = L.map("map", { attributionControl: false }).setView(
    [39.91036, 116.403704],
    10
  );
  const basemap = L.tileLayer(
    "http://map.geoq.cn/arcgis/rest/services/ChinaOnlineStreetPurplishBlue/MapServer/tile/{z}/{y}/{x}",
    {
      attribution: "",
    }
  ).addTo(map);
  // 创建标绘图层
  drawView = new L.geoJSON(null, {}).addTo(map);
  clipResultLayer = new L.geoJSON(null, {}).addTo(map);
  // 创建多边形图层及添加测试geojson数据
  polygonLayer = L.geoJSON(null, {
    style: function (feature) {
      return { color: "#fff" };
    },
  }).addTo(map);
  polygonLayer.addData({
    type: "Feature",
    geometry: {
      type: "Polygon",
      coordinates: [
        [
          [116.2535, 40.009898],
          [116.25144, 39.971495],
          [116.324225, 39.990436],
          [116.296072, 40.032509],
          [116.2535, 40.009898],
        ],
      ],
    },
  });
  polygonLayer.addData({
    type: "Feature",
    geometry: {
      type: "Polygon",
      coordinates: [
        [
          [116.490393, 39.88435],
          [116.596823, 39.895413],
          [116.626349, 39.784167],
          [116.409369, 39.775197],
          [116.490393, 39.88435],
        ],
        [
          [116.502285, 39.870091],
          [116.516018, 39.800887],
          [116.599789, 39.795744],
          [116.567001, 39.870486],
          [116.502285, 39.870091],
        ],
      ],
    },
  });
  polygonLayer.addData({
    type: "Feature",
    geometry: {
      type: "MultiPolygon",
      coordinates: [
        [
          [
            [116.361303, 39.926488],
            [116.454001, 39.935439],
            [116.437521, 39.874338],
            [116.359243, 39.876973],
            [116.361303, 39.926488],
          ],
        ],
        [
          [
            [116.49353, 40.058103],
            [116.665192, 40.06441],
            [116.677551, 39.930801],
            [116.512756, 39.947648],
            [116.49353, 40.058103],
          ],
        ],
      ],
    },
  });
  // 添加Leaflet.Draw标绘功能
  clipLineLayer = new L.Draw.Polyline(map);
  clipLineLayer.setOptions({
    showLength: false,
    shapeOptions: {
      stroke: true,
      color: "#3388ff",
      weight: 1,
      opacity: 0.7,
      dashArray: "5,5",
    },
  });
  L.drawLocal.draw.handlers.polyline.tooltip = {
    start: "点击地图开始裁剪",
    cont: "点击地图开始裁剪",
    end: "双击地图或点击最后一个点完成裁剪",
  };
  //地图或图层事件绑定
  polygonLayer.on("click", function (evt) {
    if (drawView) {
      drawView.clearLayers();
    }
    editLayer = evt.layer;
    polygonLayer.setStyle({ color: "#fff" });
    editLayer.setStyle({ color: "#ecf53e" });
    clipLineLayer.enable();
    document.getElementById("msg").innerText = "绘制切割线";
  });
  ……
</script>

<style scoped>
#map {
  width: 100vw;
  height: 100vh;
}
.titleContainer {
  position: absolute;
  top: 0;
  background: rgba(0, 0, 0, 0.45);
  height: 50px;
  width: 100vw;
  z-index: 999;
  font-size: 14px;
  color: #fff;
  font-size: 28px;
}
.center {
  display: flex;
  flex-direction: column;
  align-items: center;
  justify-content: center;
}
#msg {
  width: 200px;
  padding: 20px;
  background: #ffffff;
  position: absolute;
  bottom: 10px;
  left: 10px;
  font-size: 15px;
  z-index: 9999;
}
#reset {
  width: 100px;
  height: 40px;
  background-color: #3aa2eb;
  text-align: center;
  line-height: 40px;
  cursor: pointer;
  color: #fff;
  position: absolute;
  bottom: 10px;
  left: 300px;
  z-index: 9999;
  -webkit-transition: all 600ms ease;
  -moz-transition: all 600ms ease;
  -ms-transition: all 600ms ease;
  -o-transition: all 600ms ease;
  transition: all 600ms ease;
}
#reset:hover {
  background-color: #1b85cf;
}
#github {
  width: 50px;
  height: 50px;
  text-align: center;
  cursor: pointer;
  position: absolute;
  top: 0;
  left: 50%;
  margin-left: -25px;
  border-radius: 0 0 5px 5px;
  z-index: 9999;
  background-color: #fff;
}
.github-icon {
  margin-top: 8px;
}
.leaflet-marker-pane .leaflet-editing-icon {
  margin-left: -6px !important;
  margin-top: -6px !important;
  width: 12px !important;
  height: 12px !important;
  background: #ffffff;
  border: 1px solid rgba(0, 0, 0, 0.5);
  border-radius: 50px;
}
</style>
下载源码:GIS之家的学习交流圈
来源链接:https://www.cnblogs.com/giserhome/p/18792280
© 版权声明
本站所有资源来自于网络,仅供学习与参考,请勿用于商业用途,否则产生的一切后果将由您(转载者)自己承担!
如有侵犯您的版权,请及时联系3500663466#qq.com(#换@),我们将第一时间删除本站数据。
如有侵犯您的版权,请及时联系3500663466#qq.com(#换@),我们将第一时间删除本站数据。
THE END


暂无评论内容