


接到一位知识星友的邀请,他那边的需求是需要矢量瓦片渲染点数据,所以针对他的业务需求定制开发一个vue+oepnlayers版本的矢量瓦片渲染示例
demo源码运行环境以及配置
- 运行环境:依赖Node安装环境,demo本地Node版本:推荐v16+。
- 运行工具:vscode或者其他工具。
- 配置方式:下载demo源码,vscode打开,然后顺序执行以下命令:
(1)下载demo环境依赖包命令:npm i
(2)启动demo命令:npm run dev
(3)打包demo命令: npm run build
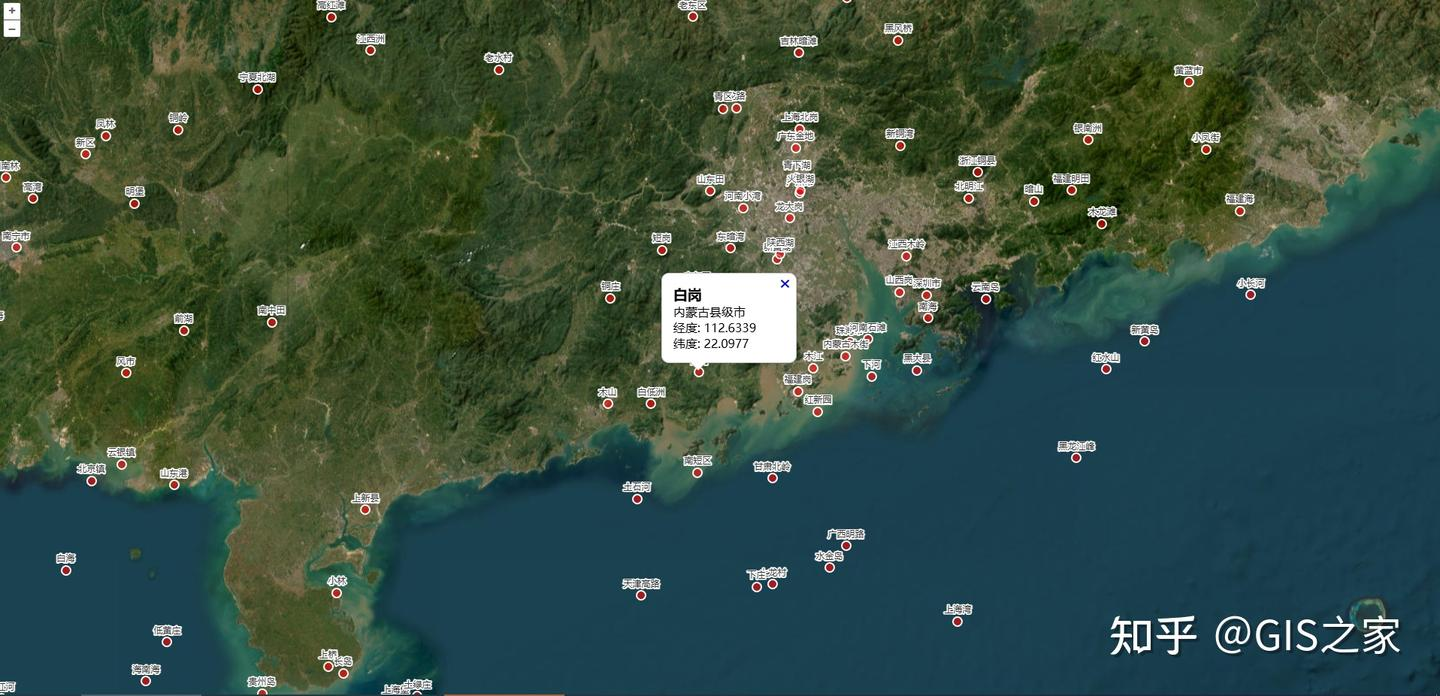
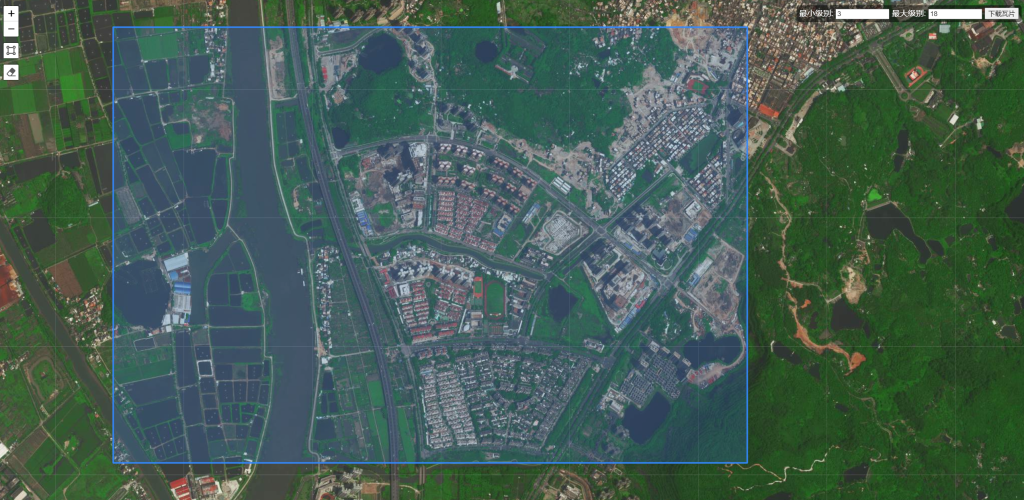
示例效果
技术栈
- 前端框架 :Vue 3.5.13
- 地图库 :OpenLayers 10.4.0
- 矢量瓦片处理 :geojson-vt 4.0.2
- 构建工具 :Vite 6.2.0
功能特点
- 基于OpenLayers实现的交互式地图
- 使用geojson-vt将GeoJSON数据转换为矢量瓦片
- 支持点击地图上的点位显示详细信息弹窗
- 鼠标悬停时显示指针样式变化
- 自定义点位样式和标签显示
- 包含1000+中国城市和地点数据
- 提供数据生成脚本,可自定义生成更多数据
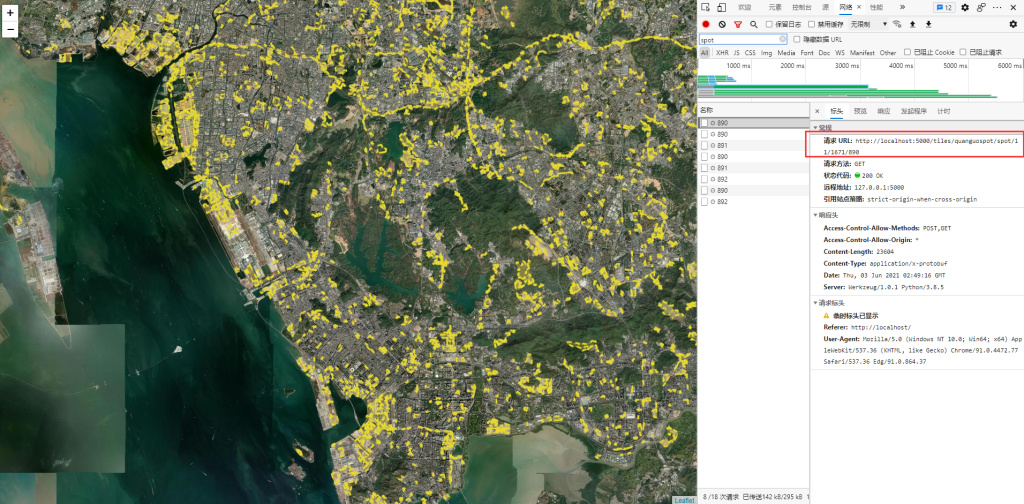
矢量瓦片实现
项目使用geojson-vt库将GeoJSON数据转换为矢量瓦片,主要实现步骤:
- 加载GeoJSON数据
- 使用
geojson-vt创建瓦片索引 - 自定义
VectorTileSource的tileUrlFunction和tileLoadFunction - 在
tileLoadFunction中从瓦片索引获取对应瓦片数据 - 将瓦片数据转换为OpenLayers的Feature对象
这种方式可以高效处理大量点位数据,提升地图渲染性能。
核心源码
<template>
    <div id="map" class="map"></div>
    <div id="popup" class="ol-popup">
        <a href="#" id="popup-closer" class="ol-popup-closer"></a>
        <div id="popup-content"></div>
    </div>
</template>

<script setup>
import { ref, onMounted } from 'vue';
import 'ol/ol.css';
import geojsonvt from 'geojson-vt';
import Map from 'ol/Map.js';
import View from 'ol/View.js';
import GeoJSON from 'ol/format/GeoJSON.js';
import VectorTileLayer from 'ol/layer/VectorTile.js';
import Projection from 'ol/proj/Projection.js';
import VectorTileSource from 'ol/source/VectorTile.js';
import TileArcGISRest from 'ol/source/TileArcGISRest';
import TileLayer from 'ol/layer/Tile';
import Overlay from 'ol/Overlay';
import { fromLonLat, toLonLat } from 'ol/proj';
import { Style, Circle, Fill, Stroke, Text } from 'ol/style';

const popup = ref(null);
const popupContent = ref(null);
const popupCloser = ref(null);
// 添加当前缩放级别的引用
const currentZoom = ref(3); // 默认值与初始zoom相同

onMounted(async () => {
    // 初始化弹窗
    popupContent.value = document.getElementById('popup-content');
    popupCloser.value = document.getElementById('popup-closer');
    popup.value = new Overlay({
        element: document.getElementById('popup'),
        autoPan: true,
        autoPanAnimation: {
            duration: 250
        }
    });
    // 关闭弹窗的点击事件
    popupCloser.value.onclick = function () {
        popup.value.setPosition(undefined);
        popupCloser.value.blur();
        return false;
    };
    // Converts geojson-vt data to GeoJSON
    const replacer = function (key, value) {
        if (!value || !value.geometry) {
            return value;
        }

        let type;
        const rawType = value.type;
        let geometry = value.geometry;
        if (rawType === 1) {
            type = 'MultiPoint';
            if (geometry.length == 1) {
                type = 'Point';
                geometry = geometry[0];
            }
        } else if (rawType === 2) {
            type = 'MultiLineString';
            if (geometry.length == 1) {
                type = 'LineString';
                geometry = geometry[0];
            }
        } else if (rawType === 3) {
            type = 'Polygon';
            if (geometry.length > 1) {
                type = 'MultiPolygon';
                geometry = [geometry];
            }
        }

        return {
            'type': 'Feature',
            'geometry': {
                'type': type,
                'coordinates': geometry,
            },
            'properties': value.tags,
        };
    };

    // 创建矢量瓦片图层样式
    const createPointStyle = (feature) => {
        // 根据当前缩放级别决定是否显示文本
        const showLabel = currentZoom.value >= 8; // 当缩放级别大于等于5时显示标签

        return new Style({
            image: new Circle({
                radius: 6,
                fill: new Fill({ color: 'rgba(255, 0, 0, 0.6)' }),
                stroke: new Stroke({ color: 'white', width: 2 })
            }),
            text: showLabel ? new Text({
                text: feature.get('name'),
                font: '12px Microsoft YaHei',
                offsetY: -15,
                fill: new Fill({ color: '#333' }),
                stroke: new Stroke({ color: '#fff', width: 3 })
            }) : null // 如果不显示标签,则设置为null
        });
    };
    const layer = new VectorTileLayer({
        // background: '#1a2b39',
        style: createPointStyle
    });

    const view = new View({
        center: fromLonLat([116.3912, 39.9073]), // 默认中心点为北京
        zoom: 3,
    });

    const map = new Map({
        layers: [
            new TileLayer({
                source: new TileArcGISRest({
                    url: 'https://services.arcgisonline.com/arcgis/rest/services/World_Imagery/MapServer'
                })
            }),
            layer],
        target: 'map',
        view: view,
        overlays: [popup.value]
    });

    // 监听视图变化事件,更新当前缩放级别
    view.on('change:resolution', function() {
        const newZoom = Math.round(view.getZoom());
        if (newZoom !== currentZoom.value) {
            currentZoom.value = newZoom;
            // 强制重新渲染图层以应用新样式
            layer.changed();
        }
    });

    // 添加点击事件,显示弹窗
    map.on('click', function (evt) {
        const feature = map.forEachFeatureAtPixel(evt.pixel, function (feature) {
            return feature;
        });

        if (feature) {
            const coordinates = feature.getGeometry().getCoordinates();
            const name = feature.get('name');
            const description = feature.get('description');

            const coordinates4326 = toLonLat(coordinates);
            popupContent.value.innerHTML = `
            <h3>${name}</h3>
            <p>${description}</p>
            <p>经度: ${coordinates4326[0].toFixed(4)}</p>
            <p>纬度: ${coordinates4326[1].toFixed(4)}</p>
          `;

            popup.value.setPosition(coordinates);
        } else {
            popup.value.setPosition(undefined);
        }
    });
    // 鼠标悬停样式
    // map.on('pointermove', function (e) {
    //     if (e.dragging) return;

    //     const pixel = map.getEventPixel(e.originalEvent);
    //     const hit = map.hasFeatureAtPixel(pixel);

    //     map.getTargetElement().style.cursor = hit ? 'pointer' : '';
    // });

    const url = 'src/public/data/data.json';
    fetch(url)
        .then(function (response) {
            return response.json();
        })
        .then(function (json) {
            const tileIndex = geojsonvt(json, {
                extent: 4096,
                debug: 1,
            });
            const format = new GeoJSON({
                // Data returned from geojson-vt is in tile pixel units
                dataProjection: new Projection({
                    code: 'TILE_PIXELS',
                    units: 'tile-pixels',
                    extent: [0, 0, 4096, 4096],
                }),
            });
         ……
        });
});
</script>

<style scoped>
.map {
    width: 100%;
    height: 100%;
}
</style>
源码下载
GIS之家的学习交流圈
来源链接:https://www.cnblogs.com/giserhome/p/18794541
© 版权声明
本站所有资源来自于网络,仅供学习与参考,请勿用于商业用途,否则产生的一切后果将由您(转载者)自己承担!
如有侵犯您的版权,请及时联系3500663466#qq.com(#换@),我们将第一时间删除本站数据。
如有侵犯您的版权,请及时联系3500663466#qq.com(#换@),我们将第一时间删除本站数据。
THE END


暂无评论内容